| Start Page |
|
 |
| Start Page |
|
|
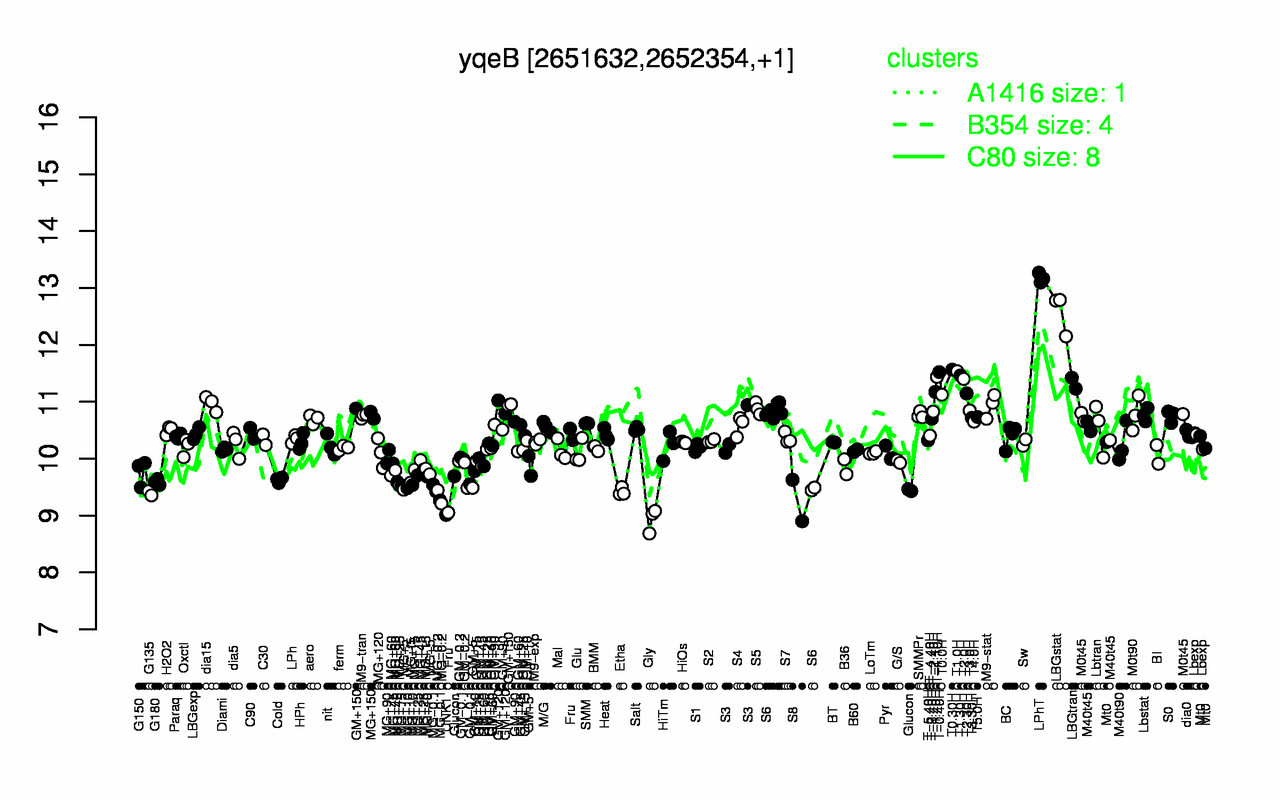
| LPhT | LBGstat | T0.30H | T1.0H | T-0.40H | T1.30H | T-1.10H | T2.0H | LBGtran | T-1.40H |
| 13.2 | 12.6 | 11.6 | 11.5 | 11.5 | 11.5 | 11.4 | 11.4 | 11.3 | 11.2 |
| Gly | UNK1 | S8 | MG-0.2 | G135 | MG-0.1 | Etha | Glucon | MG+10 | MG+t5 |
| 8.93 | 9.01 | 9.26 | 9.33 | 9.39 | 9.41 | 9.42 | 9.53 | 9.57 | 9.58 |