| Start Page |
|
 |
| Start Page |
|
|
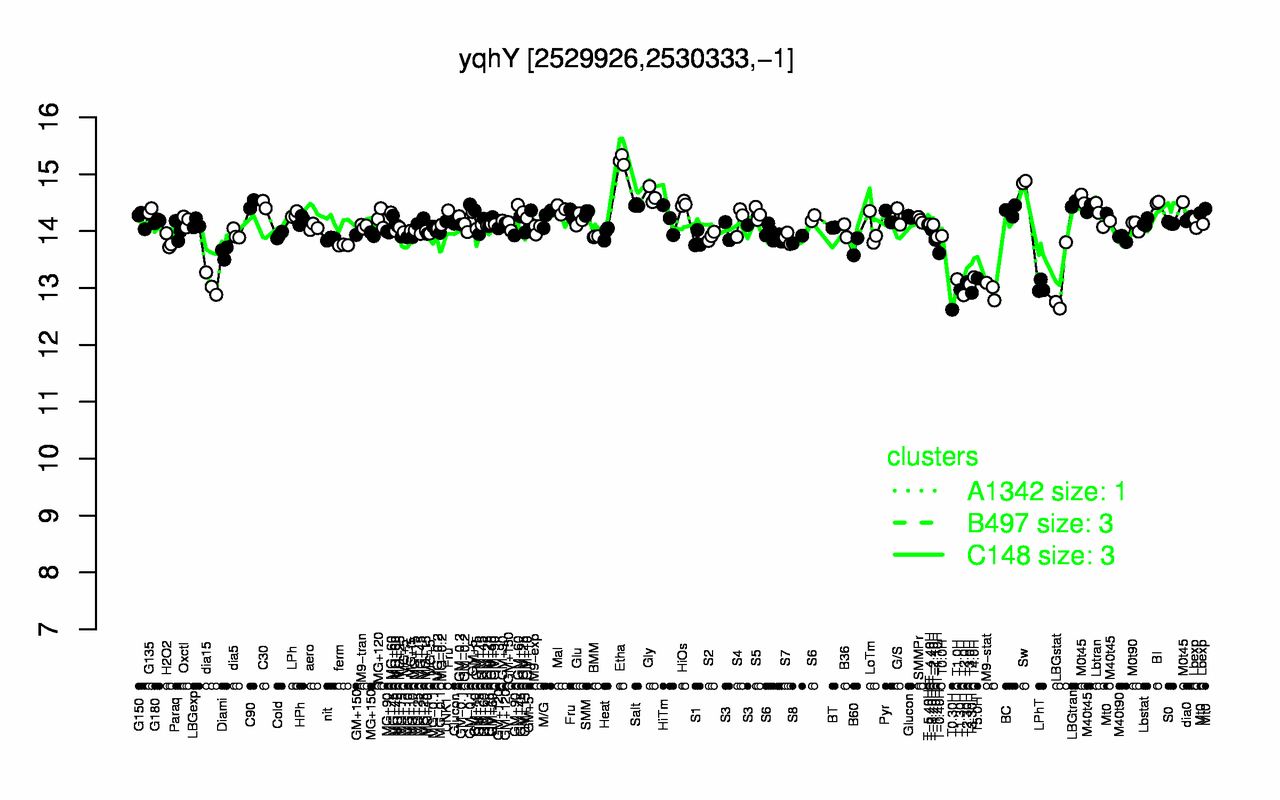
| Etha | Sw | Gly | M0t45 | BI | HiOs | LBGtran | C90 | C30 | Salt |
| 15.2 | 14.9 | 14.6 | 14.5 | 14.5 | 14.5 | 14.5 | 14.5 | 14.5 | 14.5 |
| T0.30H | T2.0H | T3.30H | M9-stat | T1.30H | LPhT | dia15 | T3.0H | LBGstat | T2.30H |
| 12.6 | 12.9 | 12.9 | 13 | 13 | 13 | 13.1 | 13.1 | 13.1 | 13.1 |