| Start Page |
|
 |
| Start Page |
|
|
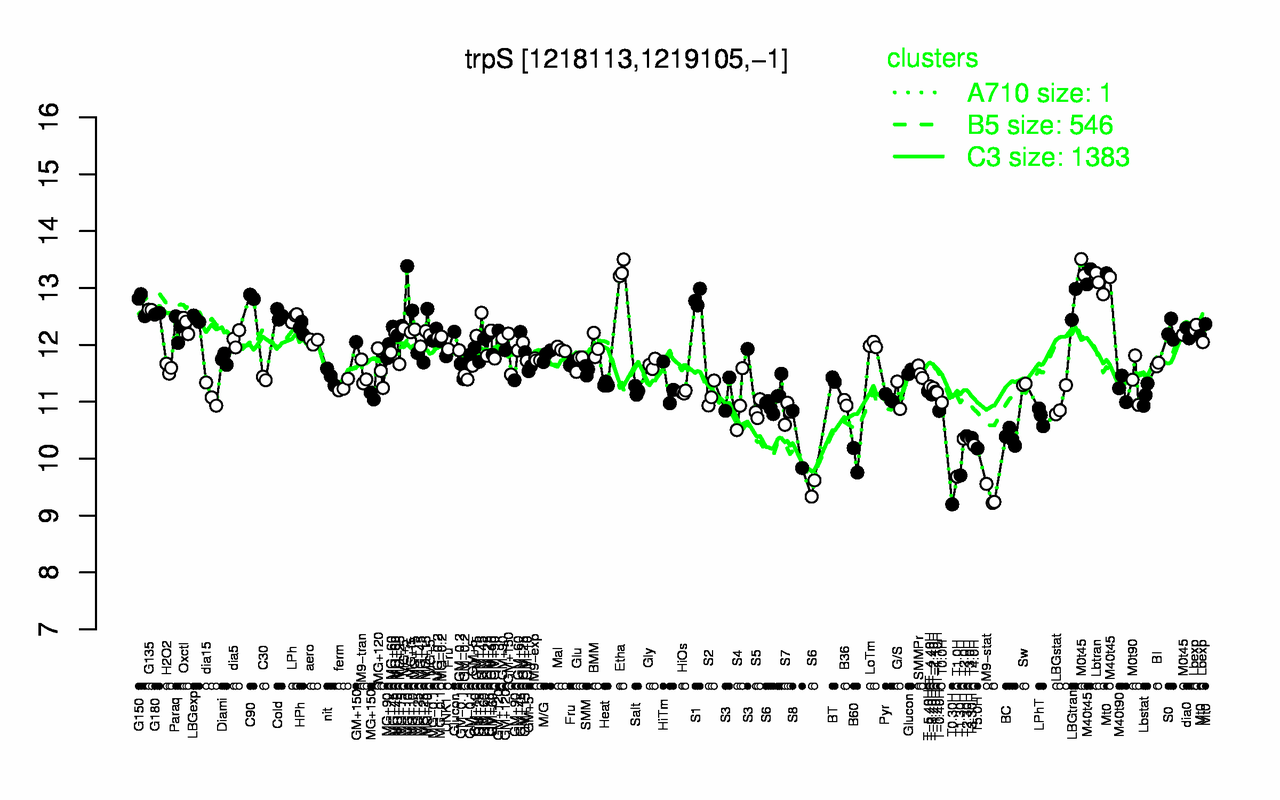
| Etha | M40t45 | Lbtran | M0t45 | MG+10 | C90 | S1 | G150 | LBGtran | G135 |
| 13.3 | 13.2 | 13.1 | 13 | 12.9 | 12.8 | 12.8 | 12.7 | 12.7 | 12.6 |
| T0.30H | M9-stat | T1.0H | T1.30H | B60 | T5.0H | T4.0H | S8 | T3.0H | T2.0H |
| 9.2 | 9.34 | 9.68 | 9.7 | 9.97 | 10.2 | 10.2 | 10.3 | 10.3 | 10.4 |