| Start Page |
|
 |
| Start Page |
|
|
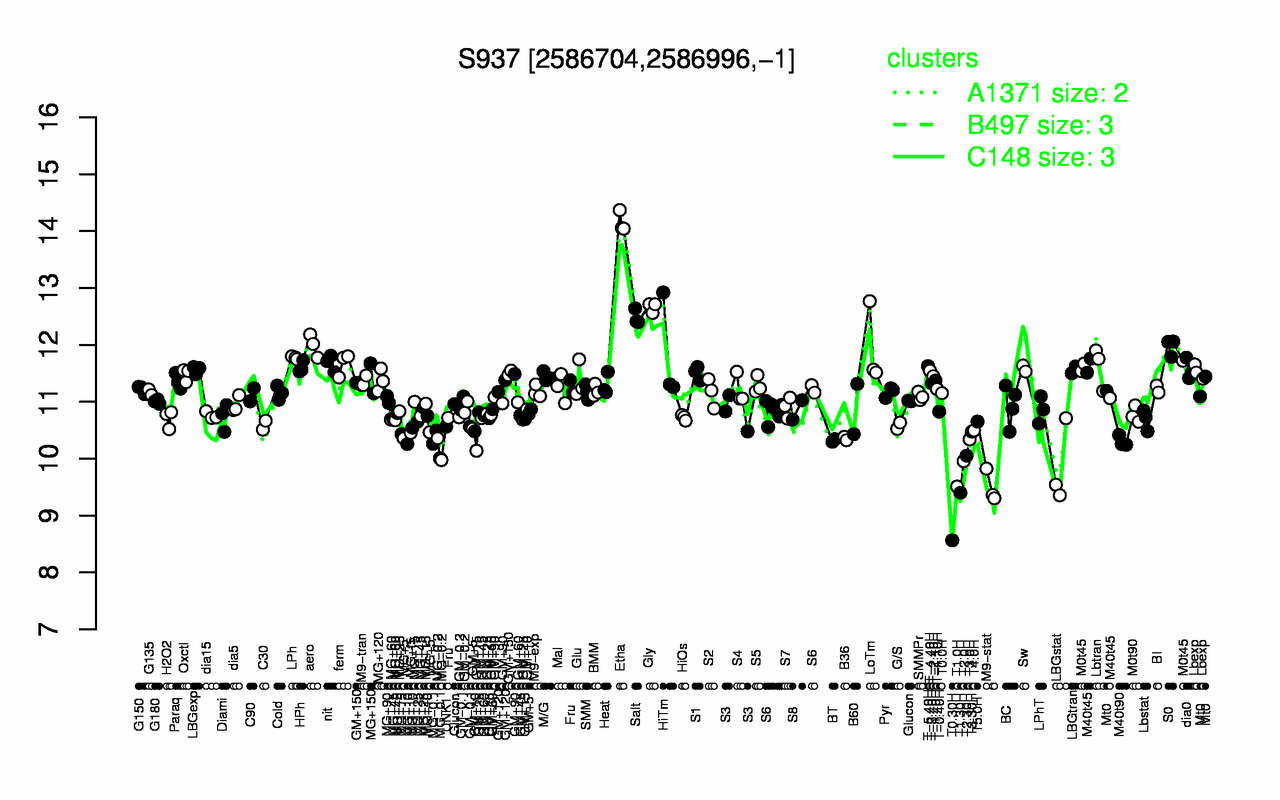
| Etha | Gly | Salt | aero | S0 | LoTm | HiTm | LPh | nit | ferm |
| 14.2 | 12.7 | 12.5 | 12 | 12 | 11.9 | 11.8 | 11.8 | 11.7 | 11.7 |
| T0.30H | T1.30H | M9-stat | T1.0H | LBGstat | T2.0H | T2.30H | MG-0.2 | MG-0.1 | M40t90 |
| 8.56 | 9.4 | 9.5 | 9.51 | 9.87 | 9.96 | 10 | 10.2 | 10.3 | 10.3 |