B. subtilis Expression Data Browser
Details about S69 Show/Hide
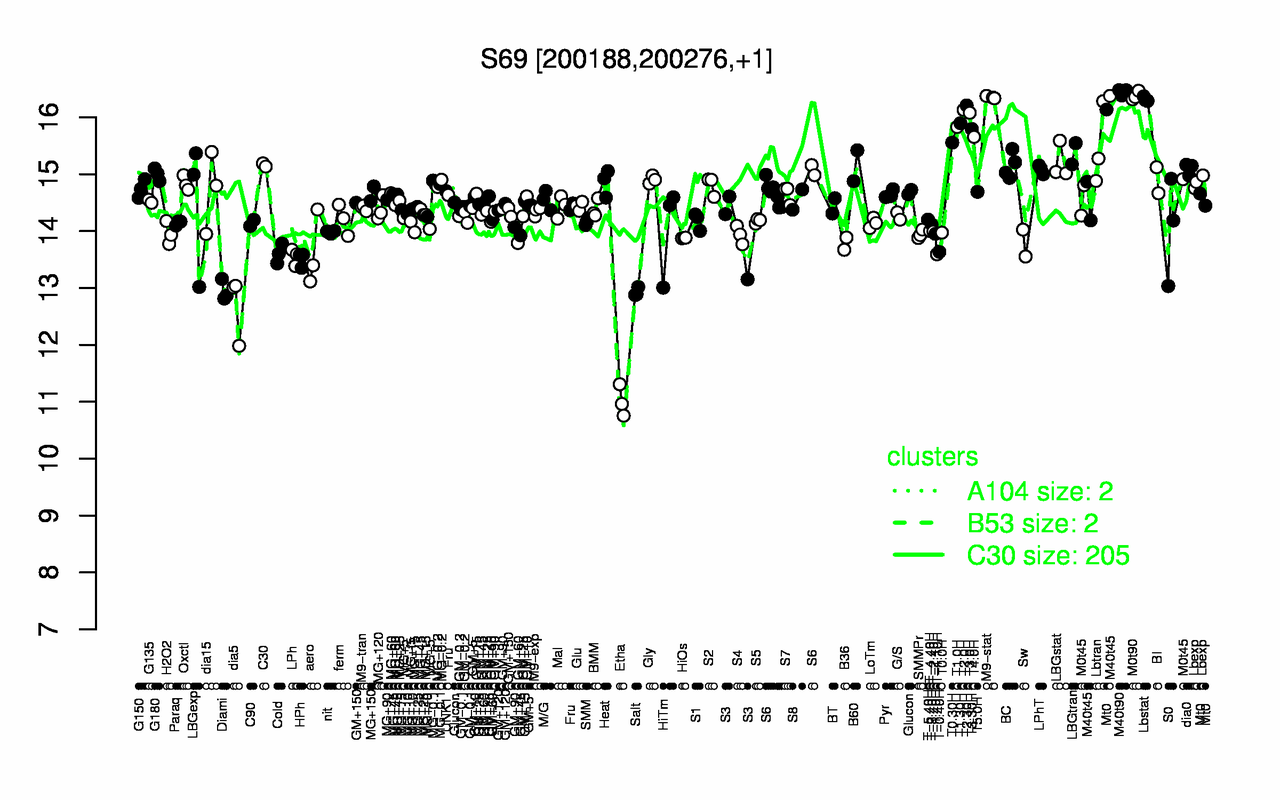
Highest Expression Conditions
M40t90 M0t90 M9-stat Lbstat T2.30H T2.0H T3.0H T1.30H T1.0H T3.30H
16.4 16.4 16.4 16.3 16.2 16.1 16.1 15.9 15.8 15.8
Lowest Expression Conditions
Etha dia5 Salt Diami HPh LPh T-1.10H Cold aero T-0.40H
11 12.7 12.9 12.9 13.5 13.6 13.6 13.6 13.6 13.6
Most Positively Correlated Segments
glmS S534 yhxA ctaB S1079 yncC phoR araA araB acuA
0.93 0.61 0.59 0.58 0.58 0.57 0.57 0.56 0.55 0.55
Most Negatively Correlated Segments
S937 yocJ yqgC truB ytiB yhgB catD S1539 rplS ykzC
-0.53 -0.52 -0.51 -0.49 -0.48 -0.47 -0.47 -0.47 -0.46 -0.46
Expression Profile of Segment S69 Show/Hide
Genomic View of Gene/Segment S69 Show/Hide
(Legend)