| Start Page |
|
 |
| Start Page |
|
|
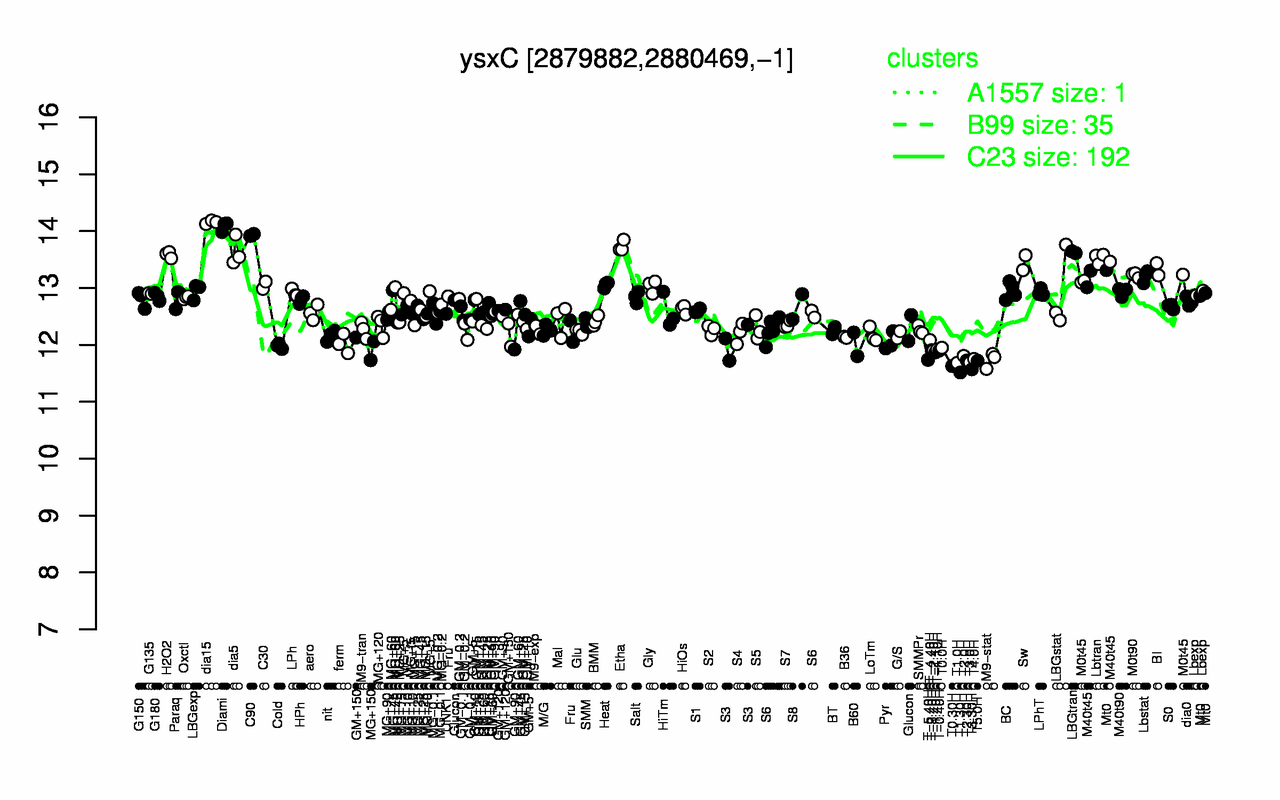
| dia15 | Diami | C90 | Etha | dia5 | LBGtran | H2O2 | Lbtran | Sw | BI |
| 14.2 | 14.1 | 13.9 | 13.7 | 13.6 | 13.6 | 13.6 | 13.5 | 13.4 | 13.3 |
| T1.30H | T3.30H | T0.30H | T1.0H | T3.0H | T5.0H | T2.30H | M9-stat | T-5.40H | T4.0H |
| 11.5 | 11.6 | 11.6 | 11.7 | 11.7 | 11.7 | 11.7 | 11.7 | 11.7 | 11.8 |