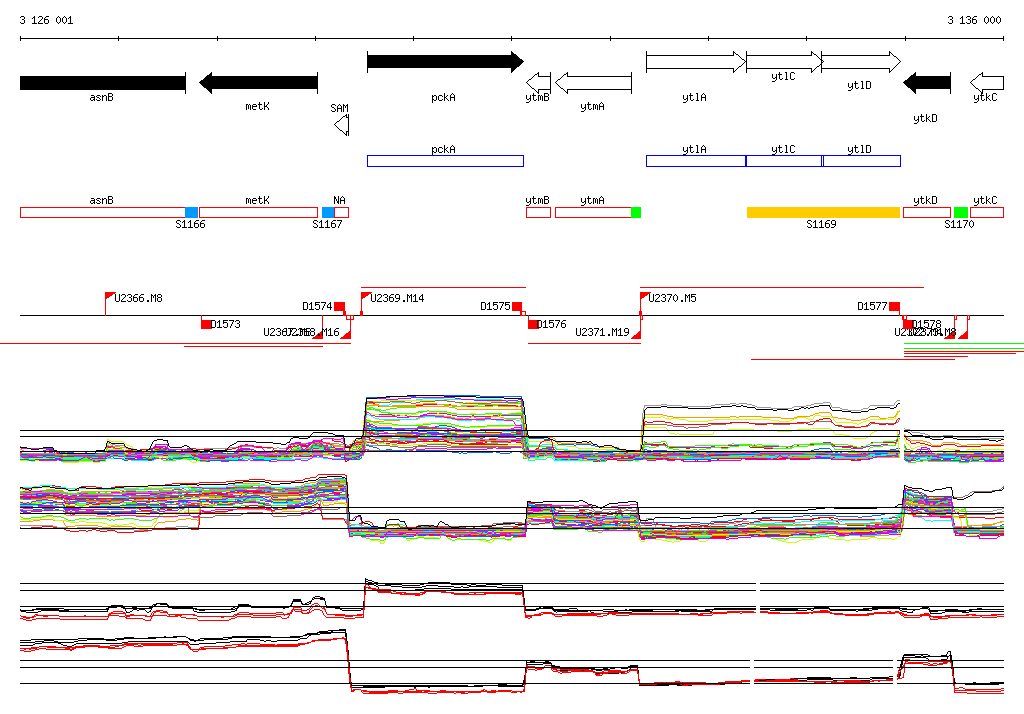
| Start Page |
|
 |
| Start Page |
|
|
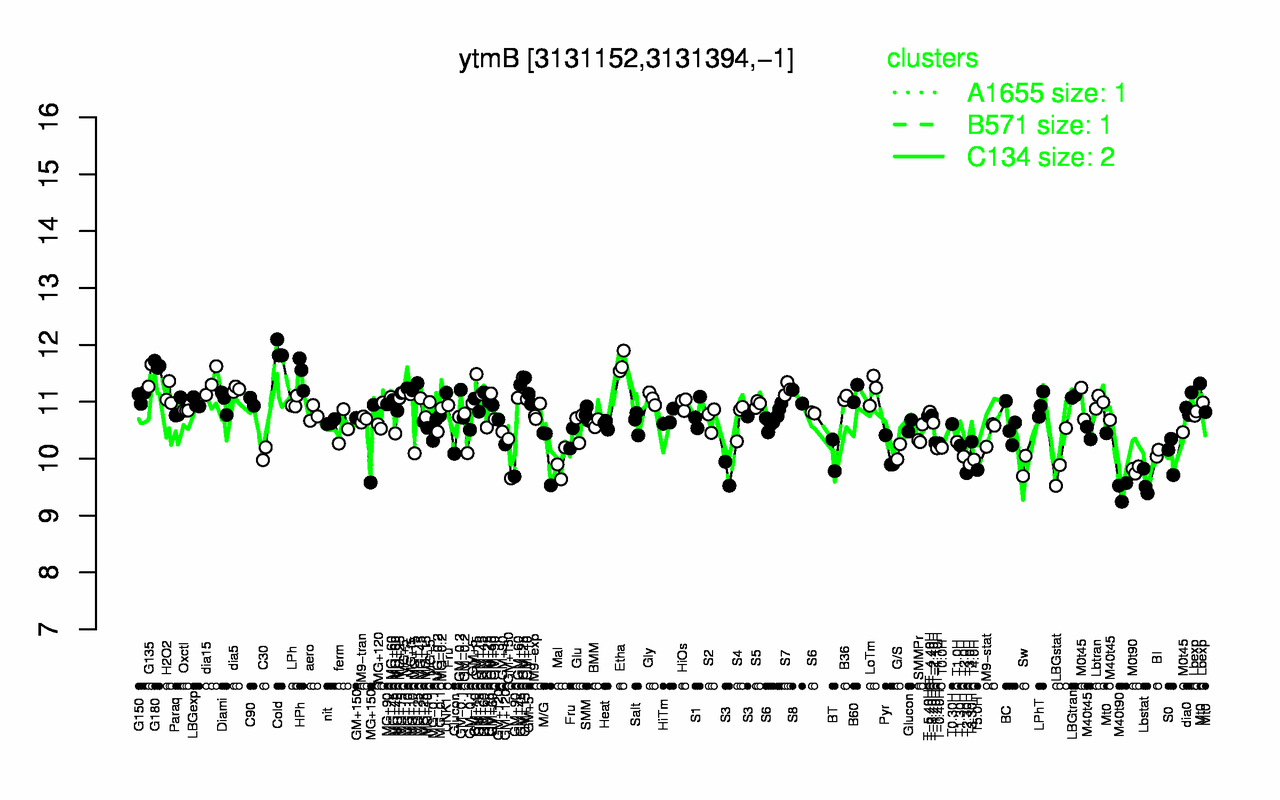
| Cold | Etha | G180 | HPh | G135 | dia15 | GM+15 | S7 | dia5 | LoTm |
| 11.9 | 11.7 | 11.6 | 11.5 | 11.5 | 11.3 | 11.3 | 11.2 | 11.2 | 11.2 |
| M40t90 | Lbstat | T2.30H | T5.0H | M0t90 | Sw | T3.0H | Mal | T4.0H | LBGstat |
| 9.45 | 9.57 | 9.75 | 9.8 | 9.81 | 9.87 | 9.9 | 9.91 | 9.98 | 9.98 |