B. subtilis Expression Data Browser
Start Page
B. subtilis Expression Data Browser
Gene/Segment:
NA
Locus Tag:
BSU_misc_RNA_15
Details about NA
Show/Hide
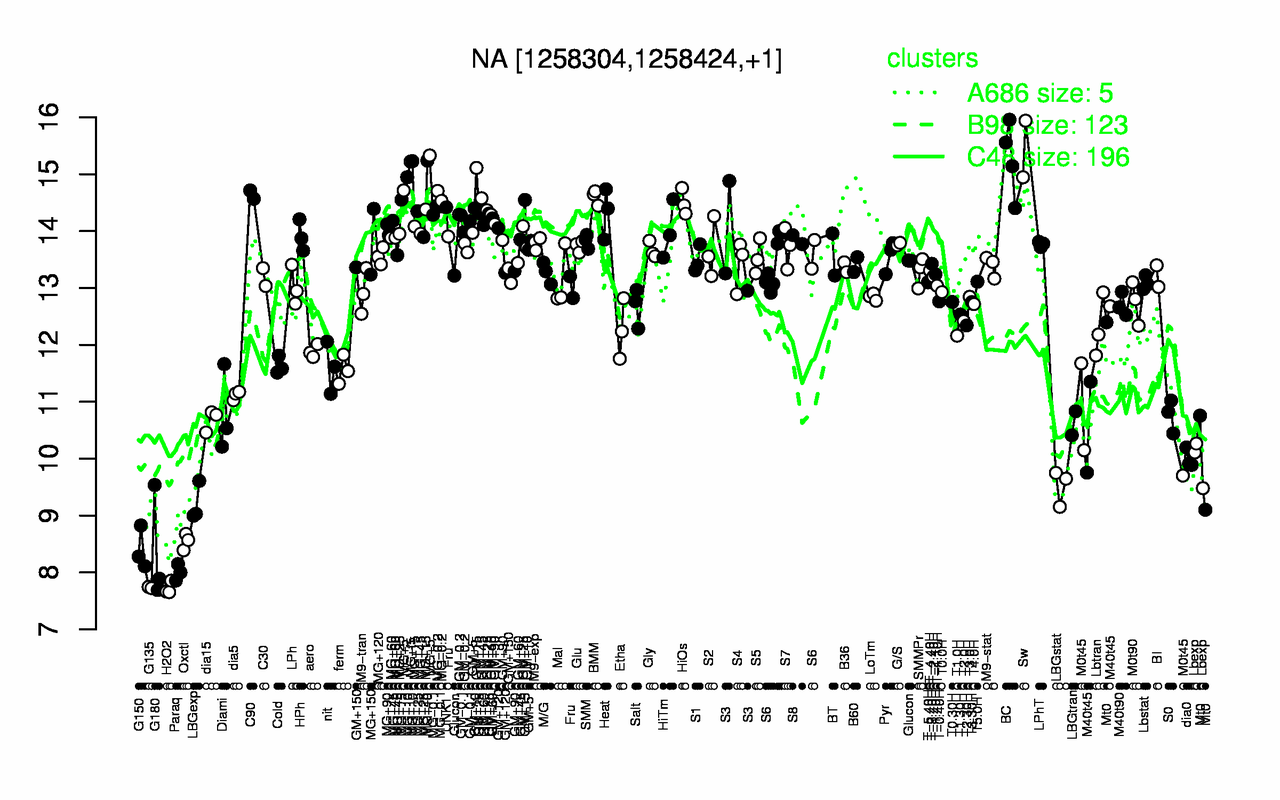
Highest Expression Conditions
Sw
BC
MG+t5
MG+10
MG+5
GM+15
C90
MG-0.2
BMM
HiOs
15.4
15.3
15.2
15.1
15
14.7
14.6
14.6
14.6
14.5
Lowest Expression Conditions
H2O2
G135
Paraq
G180
G150
Oxctl
LBGexp
LBGstat
Lbexp
dia0
7.72
7.74
8
8.37
8.4
8.55
9.21
9.52
9.95
10
Most Positively Correlated Segments
NA
mtnA
ilvA
mtnK
NA
NA
yhaA
ypmP
metC
metI
0.93
0.88
0.88
0.87
0.86
0.86
0.86
0.86
0.85
0.85
Most Negatively Correlated Segments
S893
pbuE
ansA
S520
S892
ansB
murF
mleN
S696
yoaK
-0.79
-0.79
-0.78
-0.78
-0.77
-0.76
-0.75
-0.75
-0.74
-0.73
Expression Profile of Segment NA
Show/Hide
Genomic View of Gene/Segment NA
Show/Hide
(Legend)
Browse Genome Context