| Start Page |
|
 |
| Start Page |
|
|
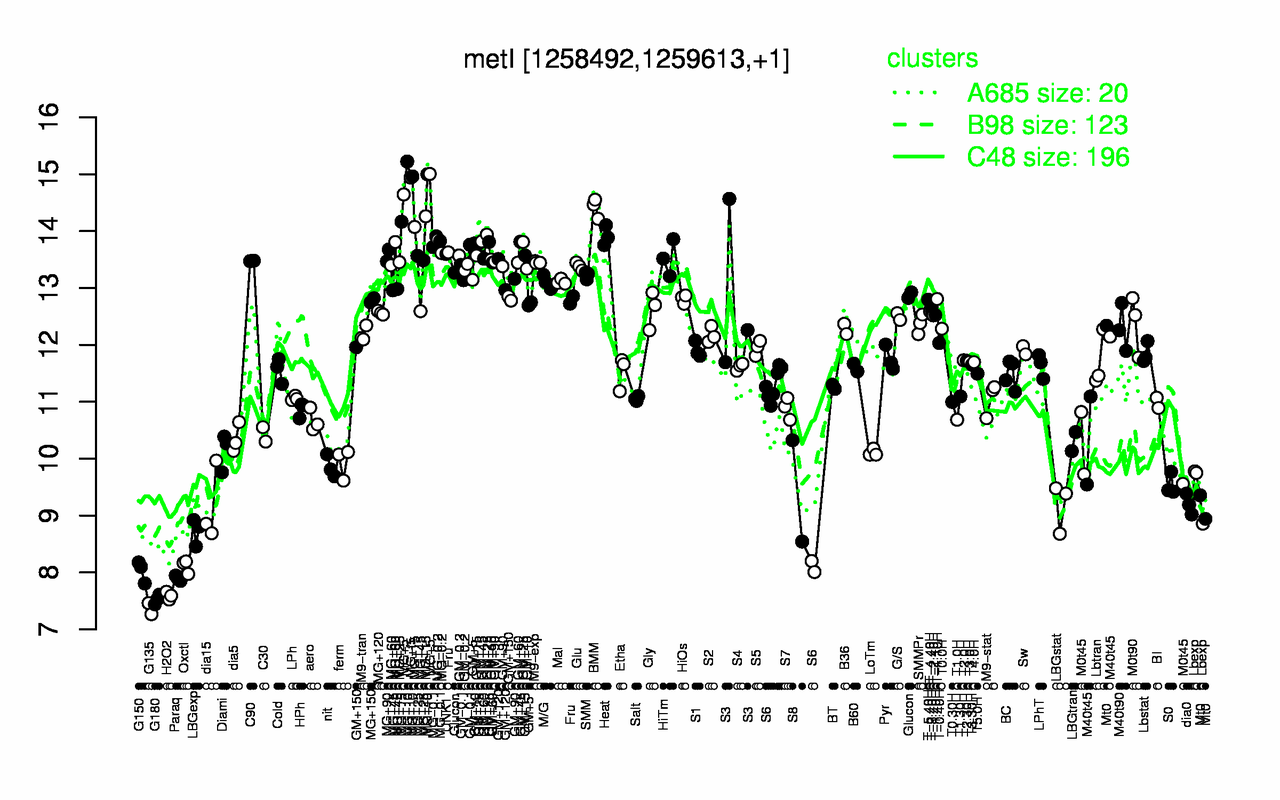
| MG+10 | MG+t5 | MG+5 | BMM | MG+15 | Heat | GM+25 | MG-0.1 | MG-0.2 | GM+45 |
| 15.1 | 14.9 | 14.8 | 14.4 | 14.2 | 13.9 | 13.8 | 13.8 | 13.7 | 13.7 |
| G135 | G180 | H2O2 | Paraq | G150 | Oxctl | LBGexp | dia15 | LBGstat | dia0 |
| 7.36 | 7.53 | 7.59 | 7.89 | 8.03 | 8.11 | 8.73 | 9.17 | 9.18 | 9.2 |