| Start Page |
|
 |
| Start Page |
|
|
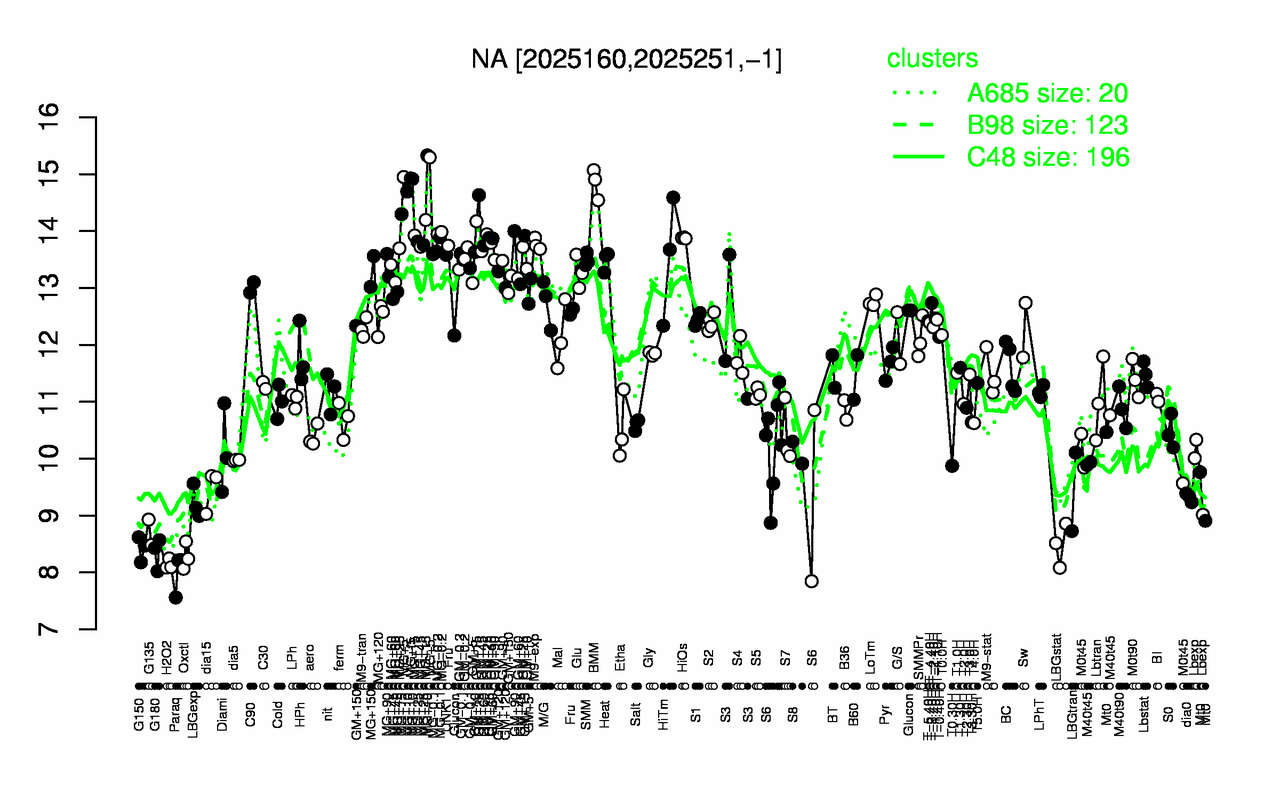
| MG+5 | MG+10 | MG+t5 | BMM | MG+15 | GM+25 | GM+15 | MG-0.2 | HiOs | M9-exp |
| 15.1 | 15 | 14.9 | 14.8 | 14.1 | 14.1 | 14 | 14 | 13.9 | 13.8 |
| Paraq | H2O2 | Oxctl | G180 | G150 | LBGstat | G135 | LBGexp | dia0 | LBGtran |
| 8 | 8.14 | 8.28 | 8.34 | 8.42 | 8.48 | 8.71 | 9.23 | 9.32 | 9.42 |