| Start Page |
|
 |
| Start Page |
|
|
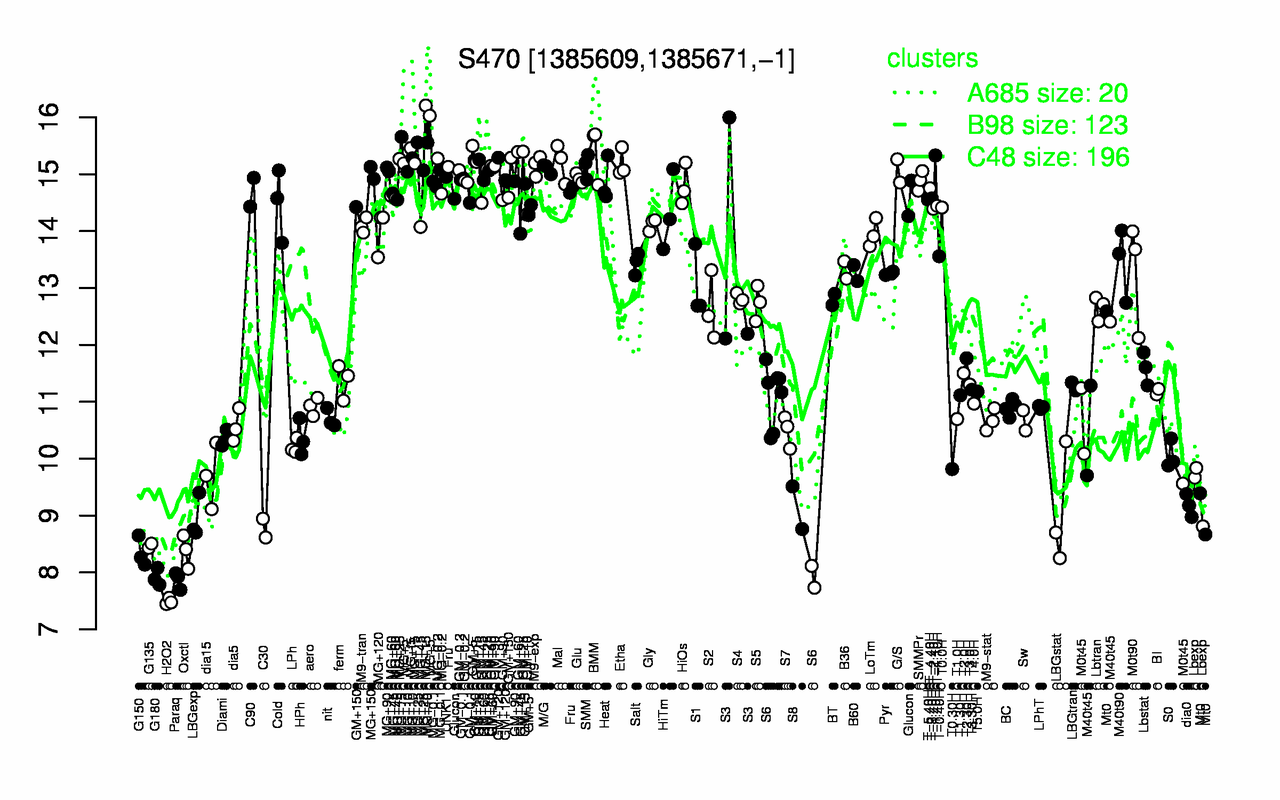
| MG+15 | MG+5 | MG+t5 | BMM | T-1.40H | MG+25 | MG+10 | GM+25 | Mal | Etha |
| 15.7 | 15.6 | 15.5 | 15.4 | 15.3 | 15.3 | 15.3 | 15.2 | 15.2 | 15.2 |
| H2O2 | Paraq | G180 | G150 | Oxctl | G135 | C30 | LBGexp | LBGstat | S8 |
| 7.49 | 7.87 | 7.91 | 8.35 | 8.37 | 8.47 | 8.78 | 8.95 | 9.09 | 9.14 |