| Start Page |
|
 |
| Start Page |
|
|
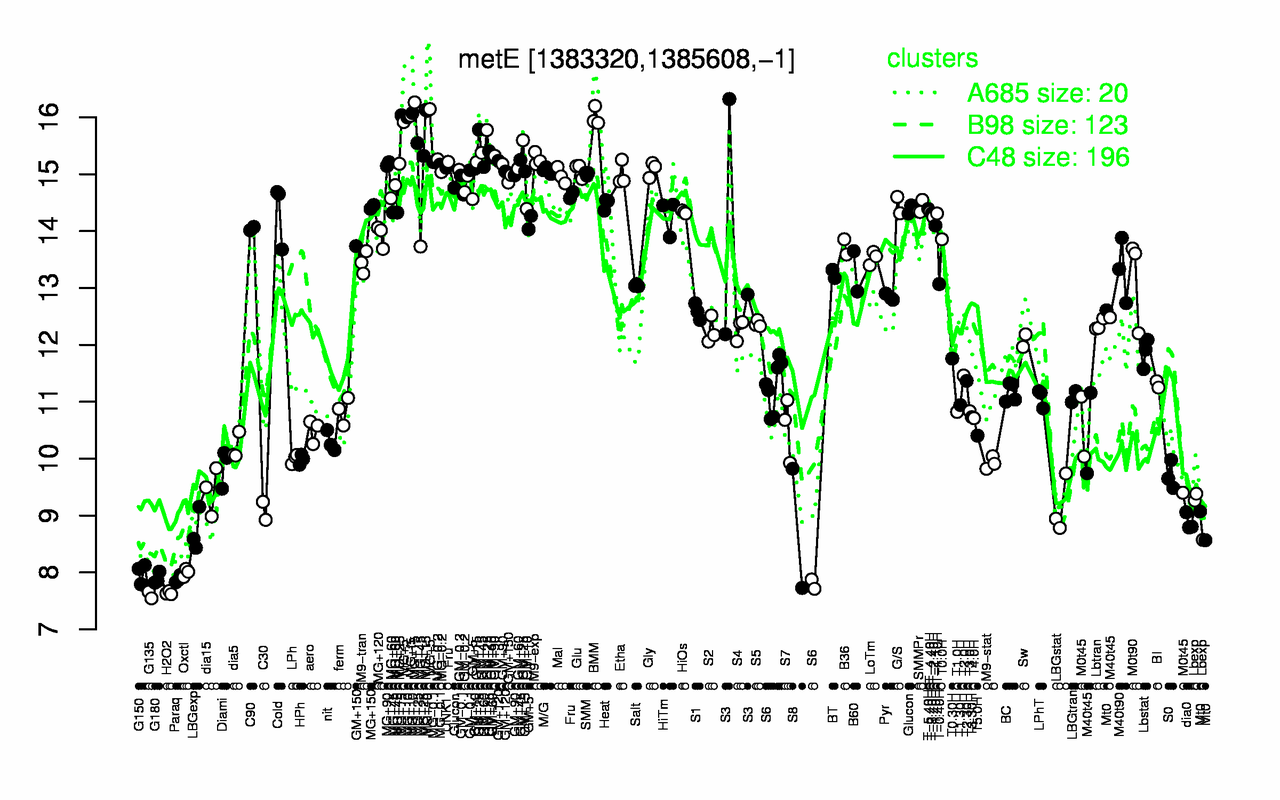
| MG+15 | MG+10 | MG+5 | MG+t5 | BMM | GM+25 | MG+25 | GM+45 | M9-exp | GM+15 |
| 16.1 | 16.1 | 16 | 16 | 16 | 15.7 | 15.4 | 15.3 | 15.3 | 15.2 |
| G135 | H2O2 | Paraq | G180 | G150 | Oxctl | LBGexp | S8 | dia0 | Lbexp |
| 7.6 | 7.64 | 7.88 | 7.89 | 7.99 | 8 | 8.73 | 8.78 | 8.88 | 9.07 |