| Start Page |
|
 |
| Start Page |
|
|
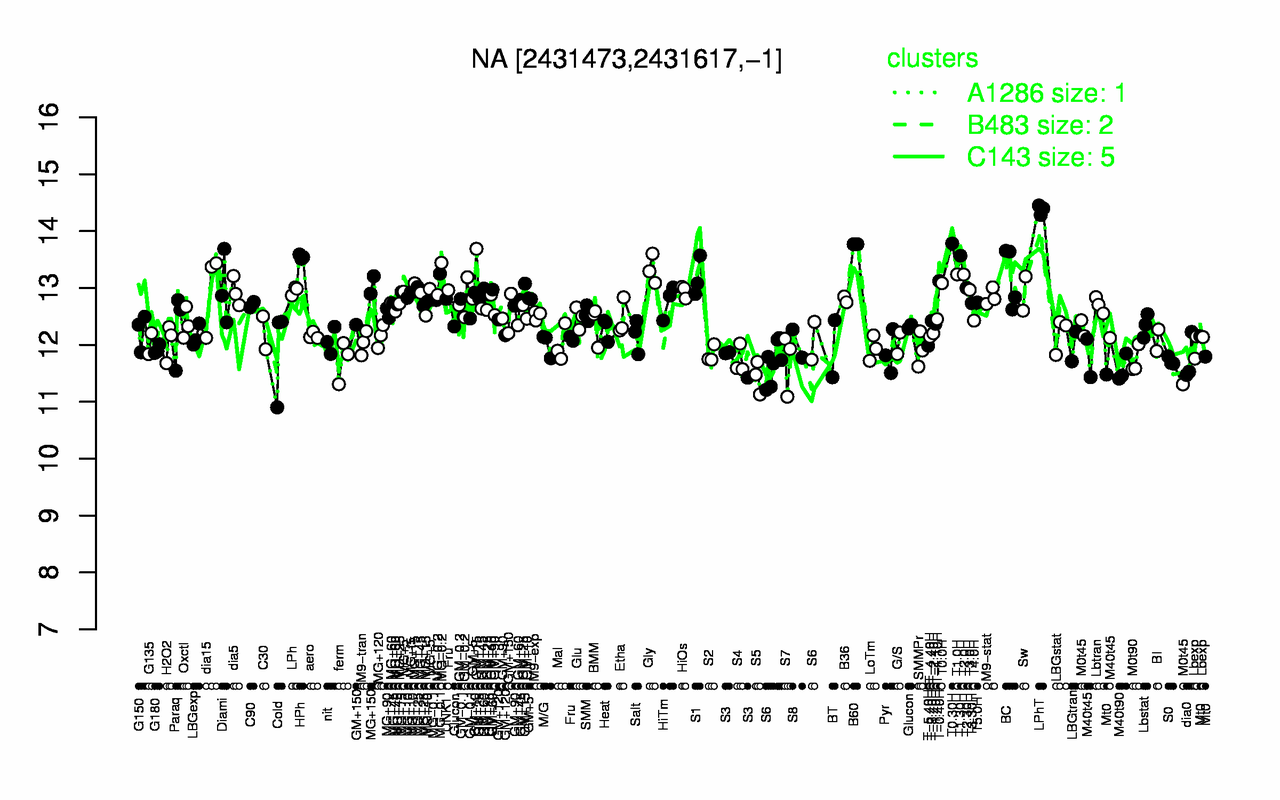
| LPhT | T0.30H | B60 | T1.30H | HPh | Gly | T1.0H | T2.0H | GM+15 | BC |
| 14.4 | 13.8 | 13.8 | 13.6 | 13.5 | 13.3 | 13.2 | 13.2 | 13.2 | 13.2 |
| S5 | M40t90 | S7 | S3 | S0 | M0t90 | ferm | S4 | dia0 | S6 |
| 11.4 | 11.6 | 11.7 | 11.7 | 11.7 | 11.7 | 11.7 | 11.7 | 11.7 | 11.8 |