| Start Page |
|
 |
| Start Page |
|
|
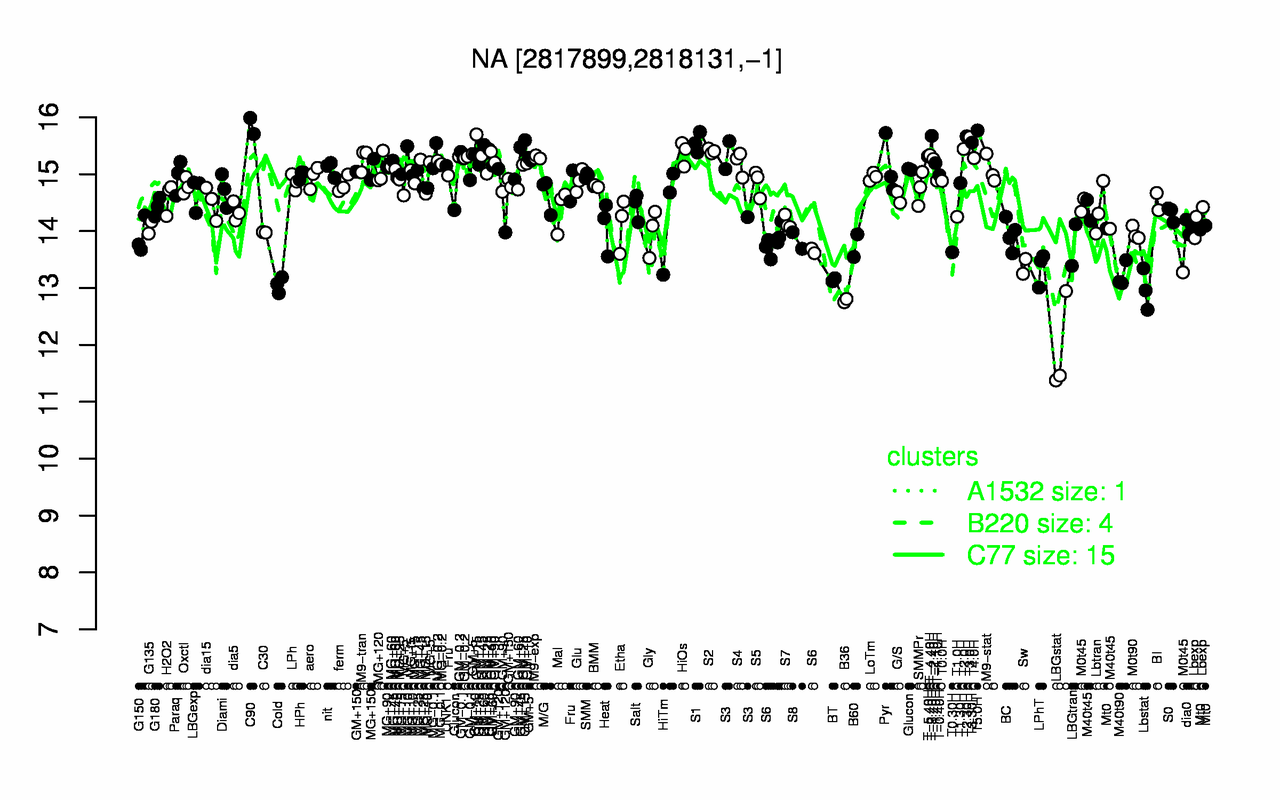
| C90 | T5.0H | T-3.40H | T2.30H | T3.0H | GM+15 | S1 | T3.30H | T2.0H | S2 |
| 15.8 | 15.8 | 15.7 | 15.7 | 15.6 | 15.6 | 15.6 | 15.6 | 15.4 | 15.4 |
| LBGstat | B36 | Lbstat | Cold | BT | M40t90 | LPhT | Sw | T0.30H | B60 |
| 11.9 | 12.8 | 13 | 13.1 | 13.1 | 13.2 | 13.3 | 13.4 | 13.6 | 13.7 |