| Start Page |
|
 |
| Start Page |
|
|
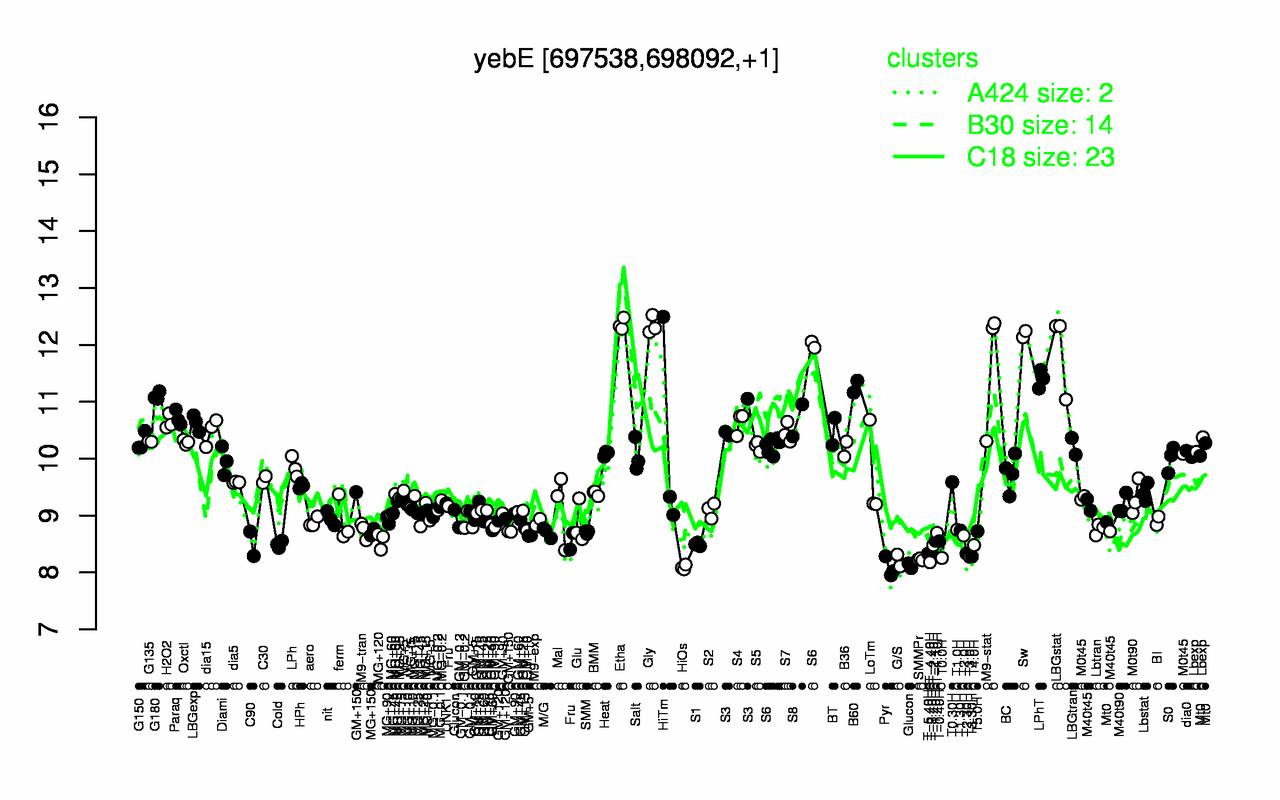
| Etha | Gly | Sw | LBGstat | M9-stat | LPhT | B60 | G180 | Paraq | S8 |
| 12.4 | 12.3 | 12.2 | 11.9 | 11.7 | 11.4 | 11.3 | 11.1 | 10.7 | 10.7 |
| Pyr | HiOs | T-4.40H | G/S | SMMPr | T0.0H | T3.0H | T3.30H | T-5.40H | T2.30H |
| 8.08 | 8.09 | 8.18 | 8.21 | 8.23 | 8.25 | 8.28 | 8.28 | 8.33 | 8.33 |