| Start Page |
|
 |
| Start Page |
|
|
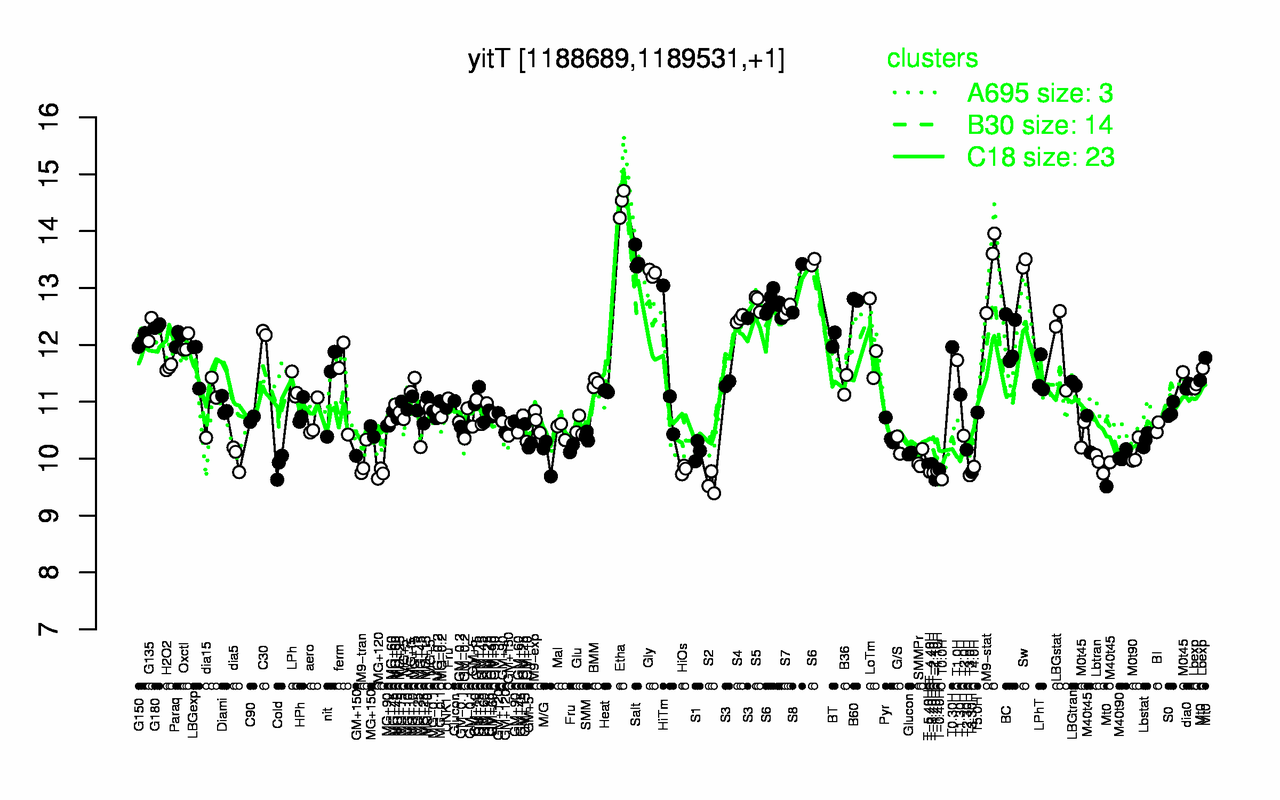
| Etha | Salt | Sw | M9-stat | Gly | S8 | S6 | B60 | S5 | S7 |
| 14.5 | 13.5 | 13.4 | 13.4 | 13.3 | 13 | 12.9 | 12.8 | 12.7 | 12.6 |
| S2 | T-1.40H | T0.0H | T3.0H | MG+120 | T-2.40H | T3.30H | T-4.40H | T-1.10H | HiOs |
| 9.56 | 9.63 | 9.64 | 9.71 | 9.74 | 9.75 | 9.76 | 9.77 | 9.79 | 9.81 |