| Start Page |
|
 |
| Start Page |
|
|
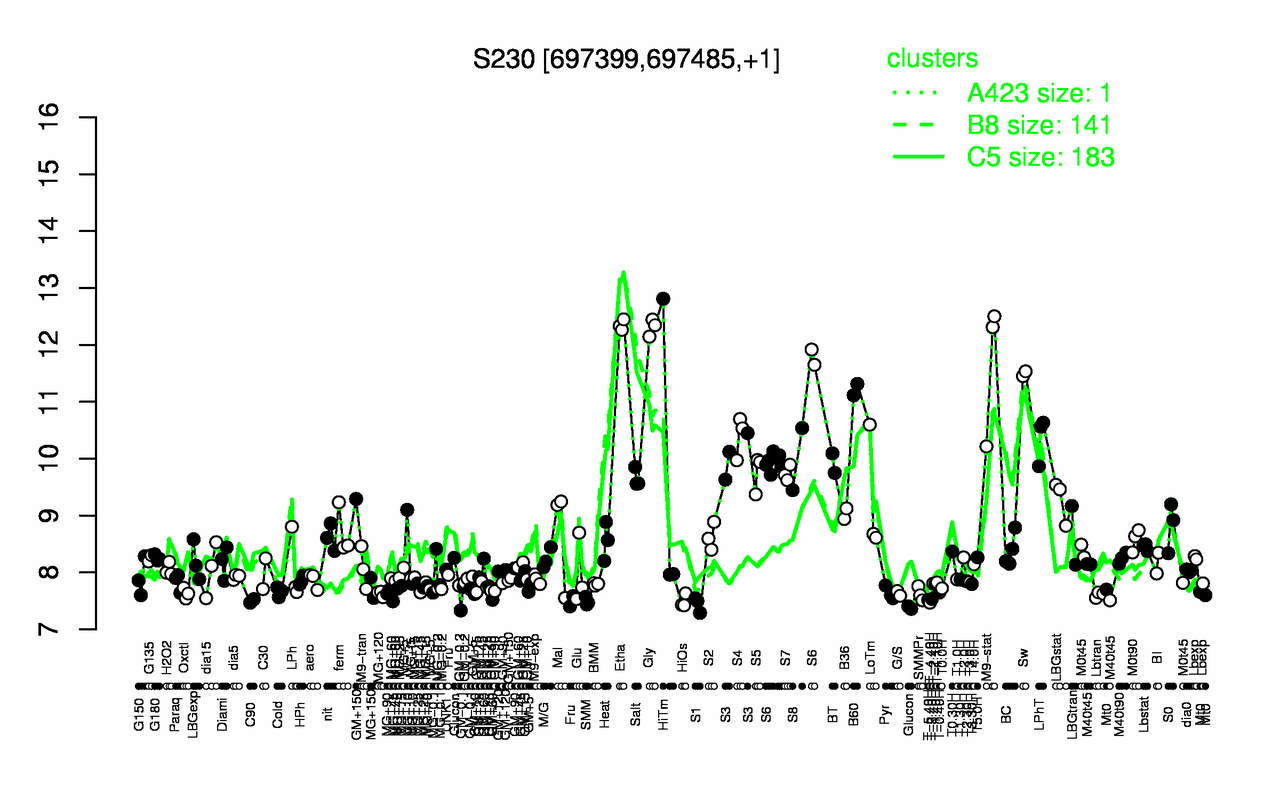
| Etha | Gly | M9-stat | Sw | B60 | S4 | S6 | LPhT | S3 | S8 |
| 12.3 | 12.3 | 11.7 | 11.5 | 11.2 | 10.4 | 10.4 | 10.4 | 10.1 | 9.99 |
| S1 | T-4.40H | SMM | HiOs | C90 | T-5.40H | T-3.40H | GM-0.1 | Lbtran | MG+45 |
| 7.44 | 7.47 | 7.49 | 7.49 | 7.5 | 7.52 | 7.53 | 7.6 | 7.61 | 7.62 |