| Start Page |
|
 |
| Start Page |
|
|
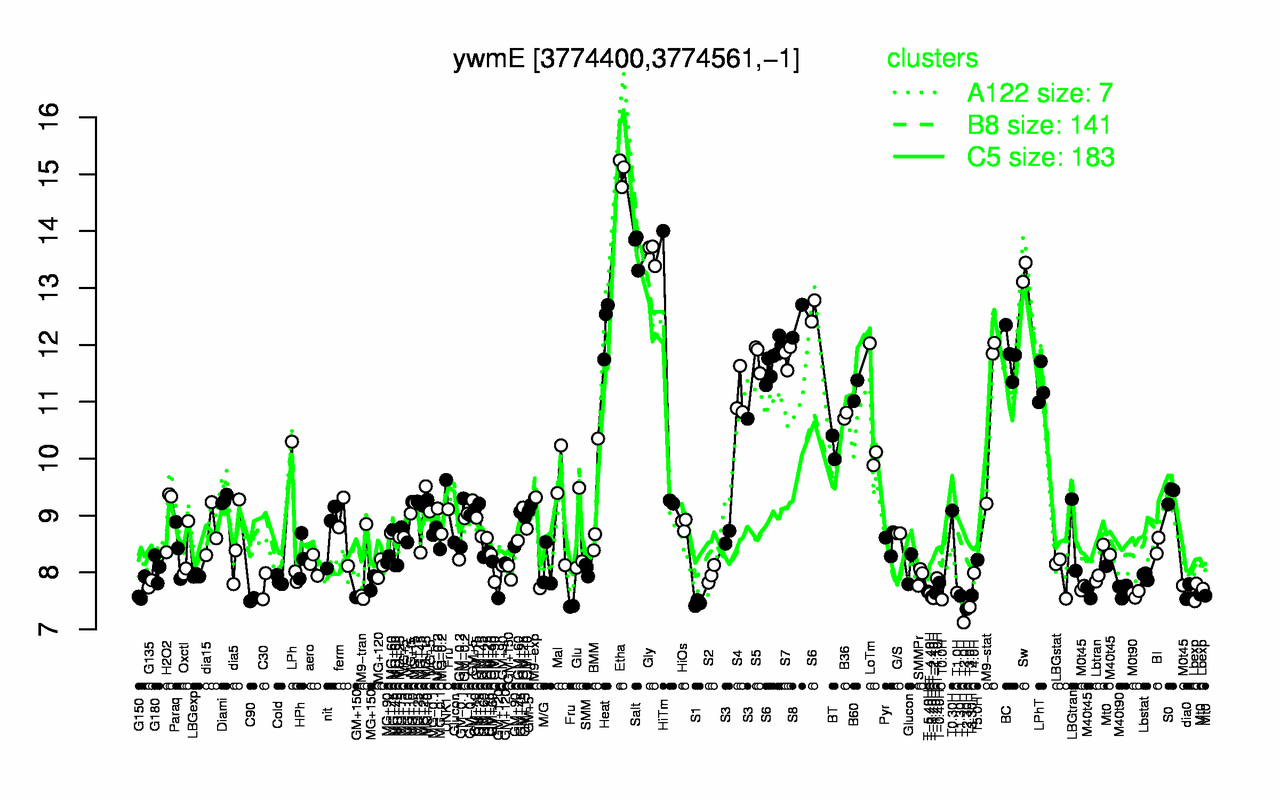
| Etha | Salt | Gly | Sw | S8 | Heat | S6 | BC | S7 | S5 |
| 15 | 13.7 | 13.6 | 13.3 | 12.4 | 12.3 | 11.9 | 11.8 | 11.8 | 11.8 |
| T2.0H | T2.30H | T3.0H | S1 | C90 | T0.0H | T-2.40H | T-3.40H | T1.30H | T3.30H |
| 7.12 | 7.36 | 7.39 | 7.46 | 7.52 | 7.52 | 7.55 | 7.57 | 7.59 | 7.59 |