| Start Page |
|
 |
| Start Page |
|
|
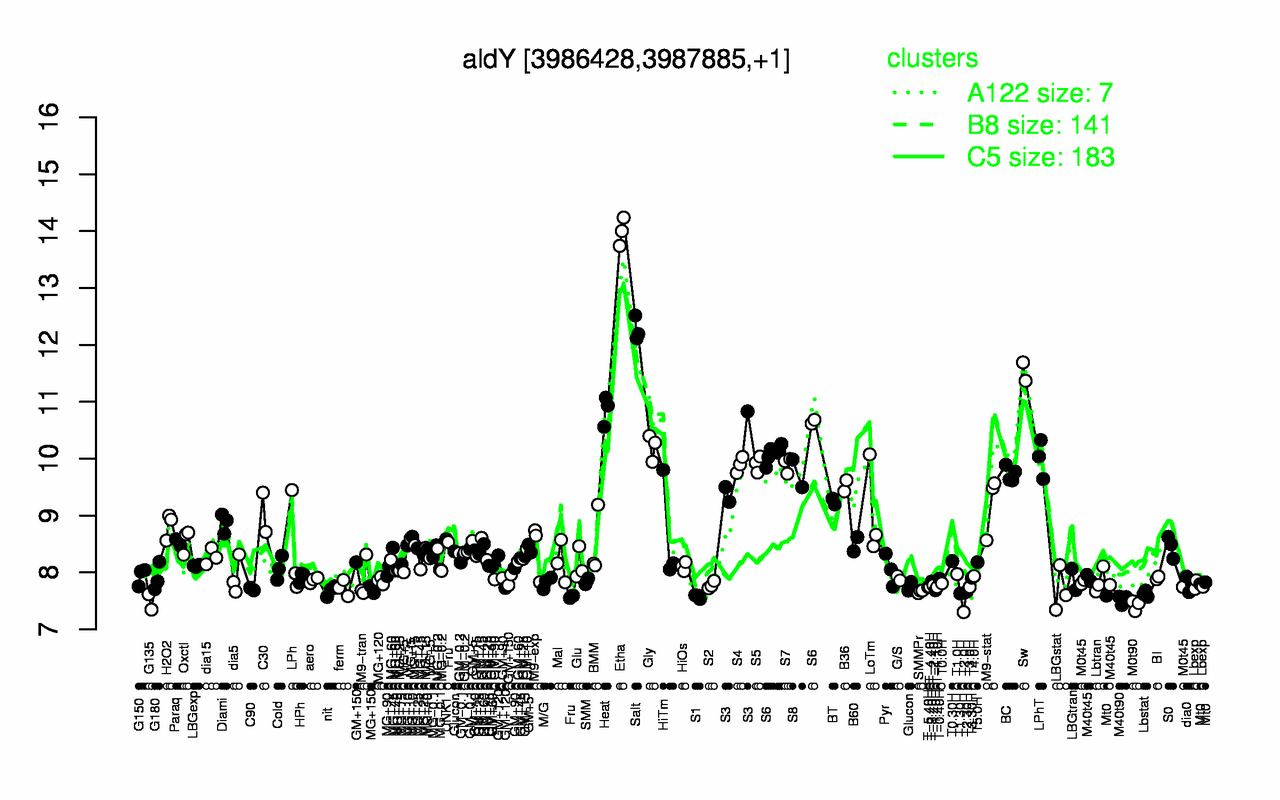
| Etha | Salt | Sw | Heat | S6 | Gly | LPhT | S5 | S7 | S4 |
| 14 | 12.3 | 11.5 | 10.9 | 10.2 | 10.2 | 10 | 9.91 | 9.9 | 9.89 |
| T2.0H | M0t90 | G135 | M40t90 | S1 | Lbstat | T1.30H | T2.30H | SMMPr | nit |
| 7.3 | 7.42 | 7.48 | 7.52 | 7.58 | 7.62 | 7.63 | 7.66 | 7.67 | 7.68 |