| Start Page |
|
 |
| Start Page |
|
|
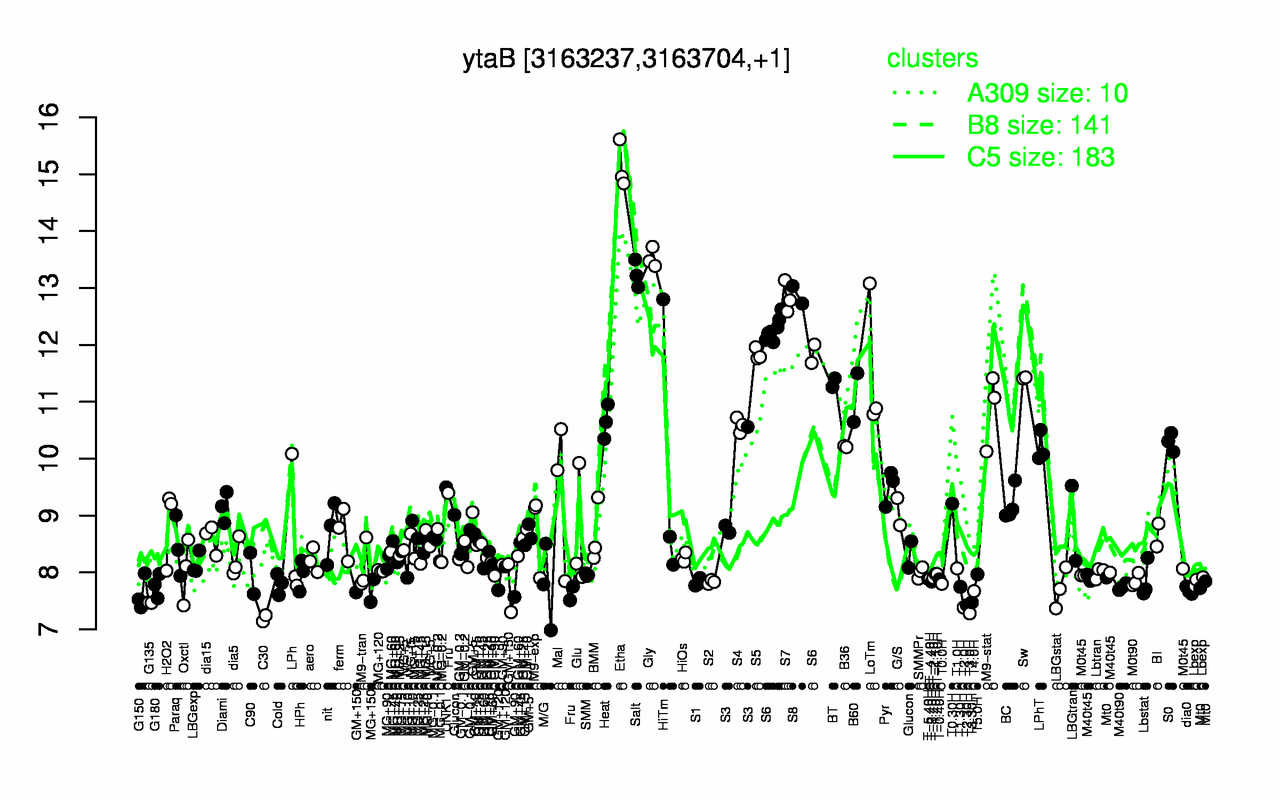
| Etha | Gly | Salt | S8 | S7 | S6 | S5 | LoTm | Sw | BT |
| 15.1 | 13.5 | 13.2 | 12.9 | 12.8 | 12.2 | 11.8 | 11.6 | 11.4 | 11.3 |
| C30 | T3.0H | T2.0H | T2.30H | G135 | T3.30H | G150 | T4.0H | MG+150 | dia0 |
| 7.19 | 7.28 | 7.38 | 7.42 | 7.47 | 7.47 | 7.63 | 7.67 | 7.68 | 7.68 |