| Start Page |
|
 |
| Start Page |
|
|
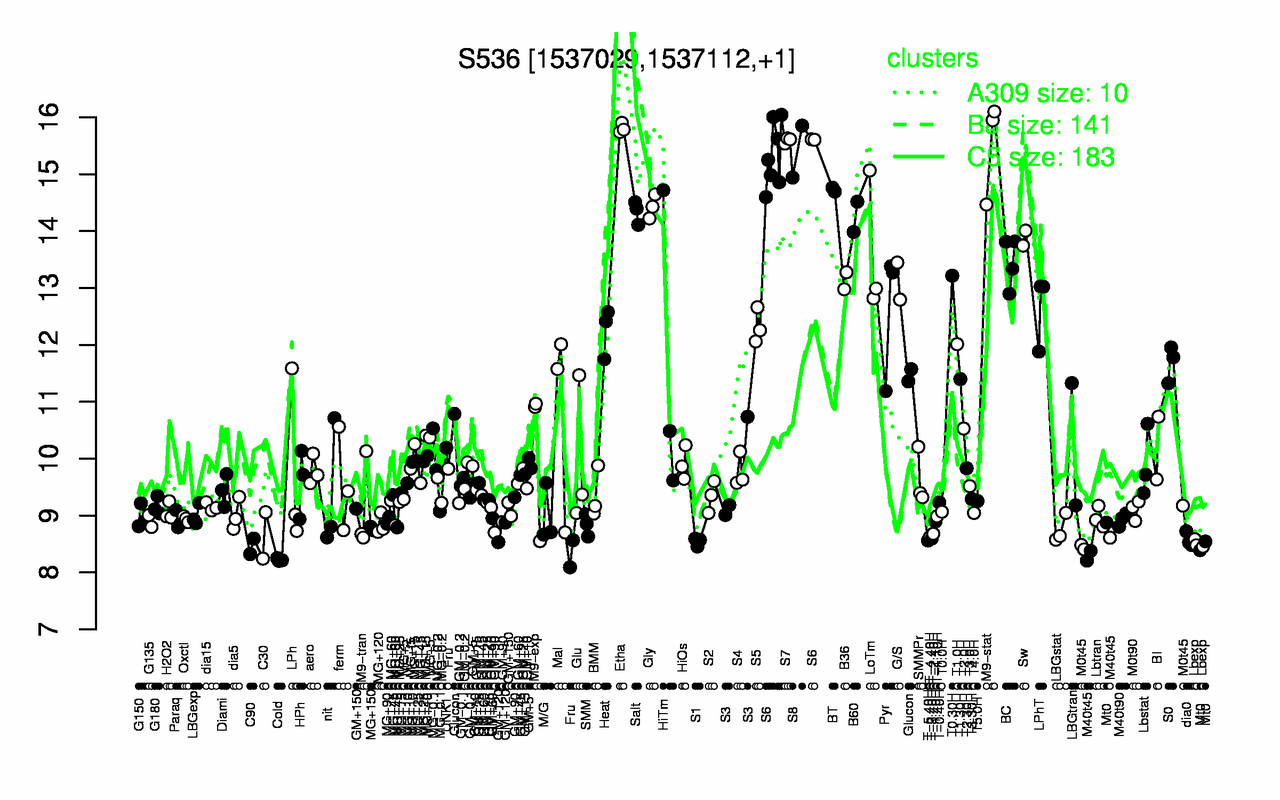
| Etha | S7 | M9-stat | S6 | S8 | BT | Gly | Salt | B60 | Sw |
| 15.8 | 15.6 | 15.5 | 15.4 | 15.4 | 14.7 | 14.4 | 14.3 | 14.3 | 13.9 |
| Cold | M40t45 | C90 | Lbexp | S1 | T-5.40H | dia0 | T-3.40H | Mt0 | T-4.40H |
| 8.22 | 8.4 | 8.46 | 8.51 | 8.54 | 8.56 | 8.58 | 8.6 | 8.6 | 8.62 |