| Start Page |
|
 |
| Start Page |
|
|
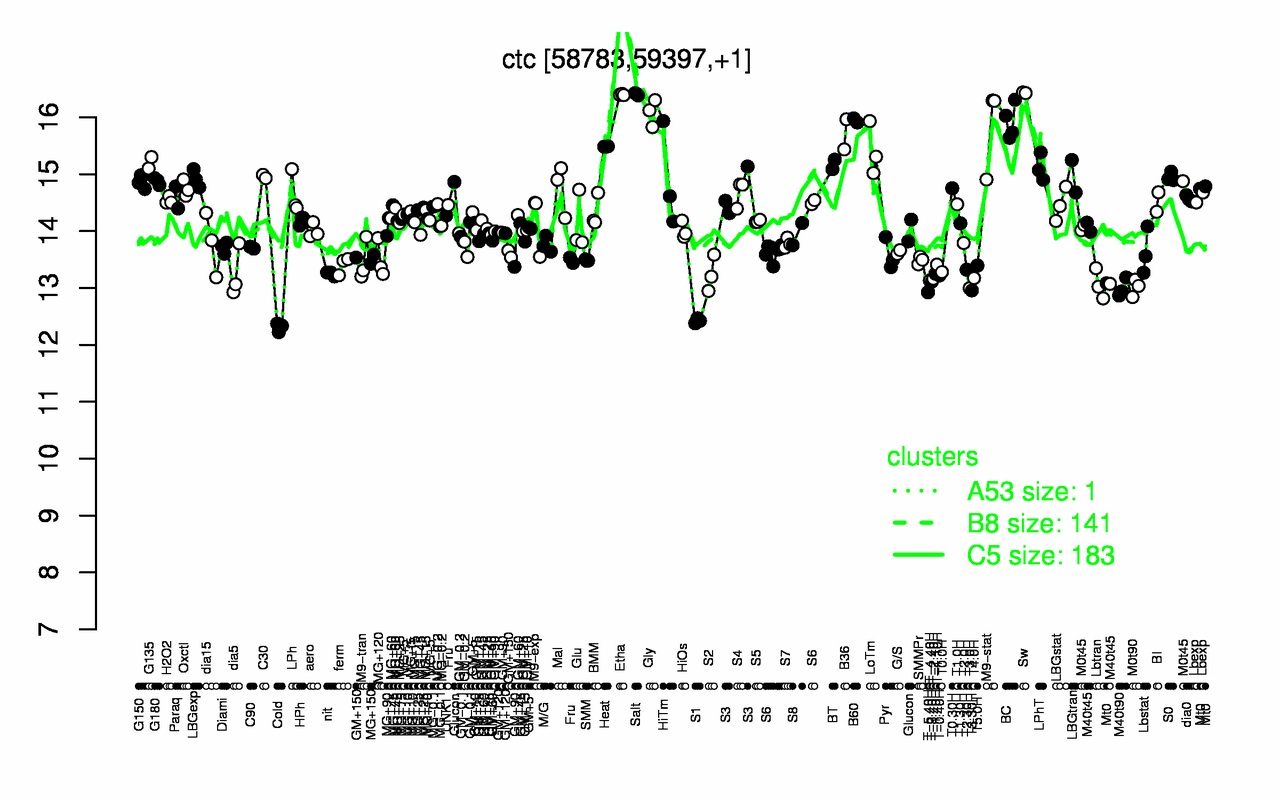
| Sw | Salt | Etha | Gly | B60 | BC | M9-stat | B36 | Heat | LoTm |
| 16.4 | 16.4 | 16.4 | 16.1 | 15.9 | 15.9 | 15.8 | 15.7 | 15.5 | 15.4 |
| Cold | S1 | T-5.40H | T3.30H | T3.0H | M40t90 | M0t90 | Lbtran | T-3.40H | T-4.40H |
| 12.3 | 12.4 | 12.9 | 13 | 13 | 13 | 13 | 13.1 | 13.1 | 13.1 |