| Start Page |
|
 |
| Start Page |
|
|
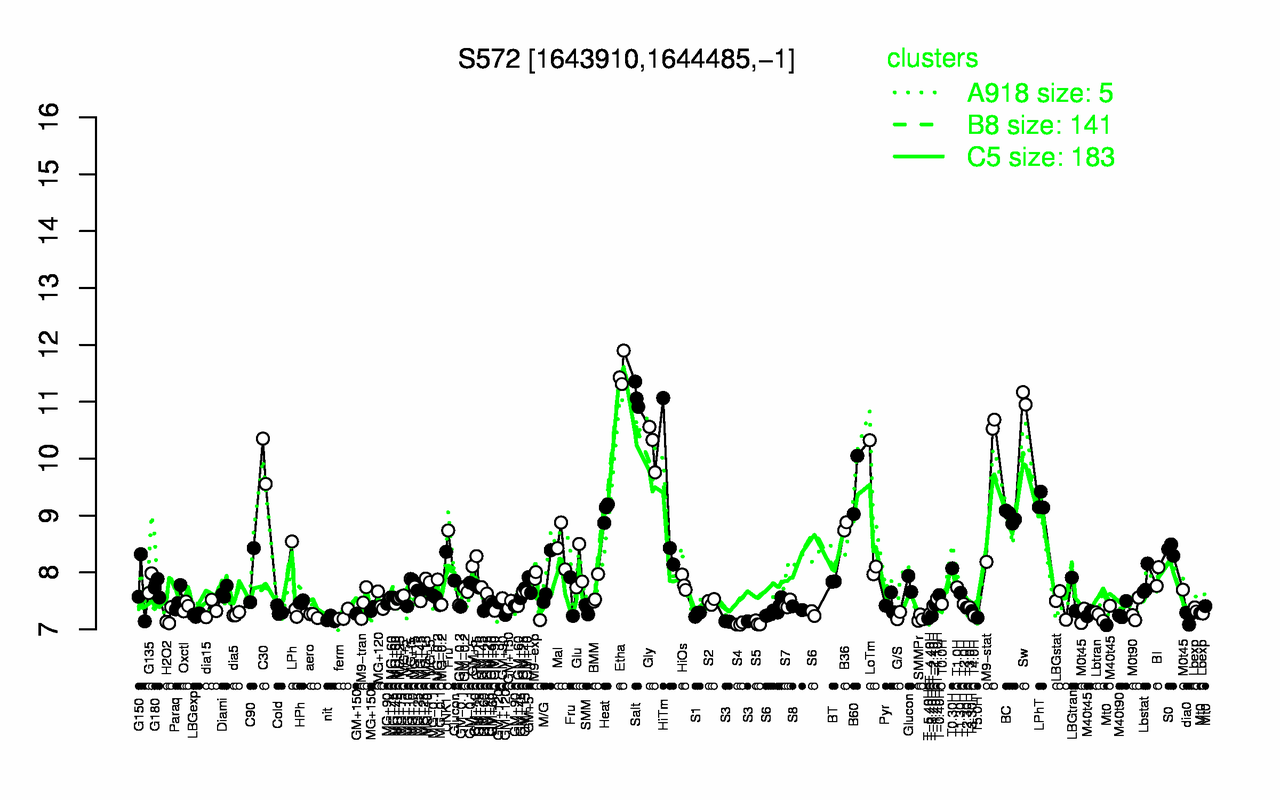
| Etha | Salt | Sw | Gly | C30 | M9-stat | B60 | LPhT | HiTm | Heat |
| 11.5 | 11.1 | 11.1 | 10.2 | 9.95 | 9.8 | 9.54 | 9.24 | 9.21 | 9.07 |
| S4 | S5 | S3 | nit | T-5.40H | SMMPr | T5.0H | H2O2 | dia0 | T-3.40H |
| 7.1 | 7.11 | 7.14 | 7.18 | 7.19 | 7.2 | 7.2 | 7.21 | 7.22 | 7.24 |