| Start Page |
|
 |
| Start Page |
|
|
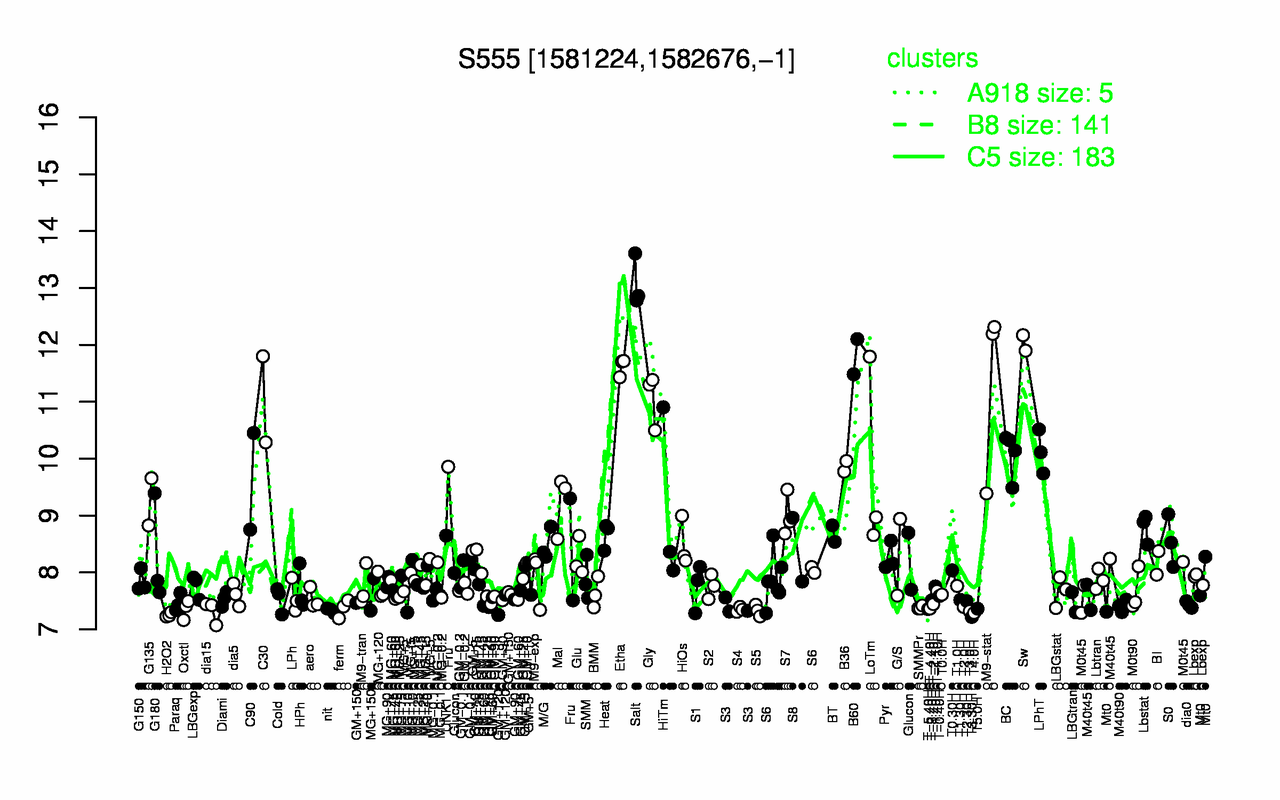
| Salt | Sw | B60 | Etha | M9-stat | Gly | C30 | LPhT | BC | B36 |
| 13.1 | 12 | 11.8 | 11.6 | 11.3 | 11.1 | 11 | 10.1 | 10.1 | 9.87 |
| T3.30H | H2O2 | T4.0H | dia15 | T3.0H | S5 | nit | S4 | Oxctl | T-5.40H |
| 7.22 | 7.26 | 7.29 | 7.31 | 7.32 | 7.33 | 7.33 | 7.35 | 7.36 | 7.36 |