| Start Page |
|
 |
| Start Page |
|
|
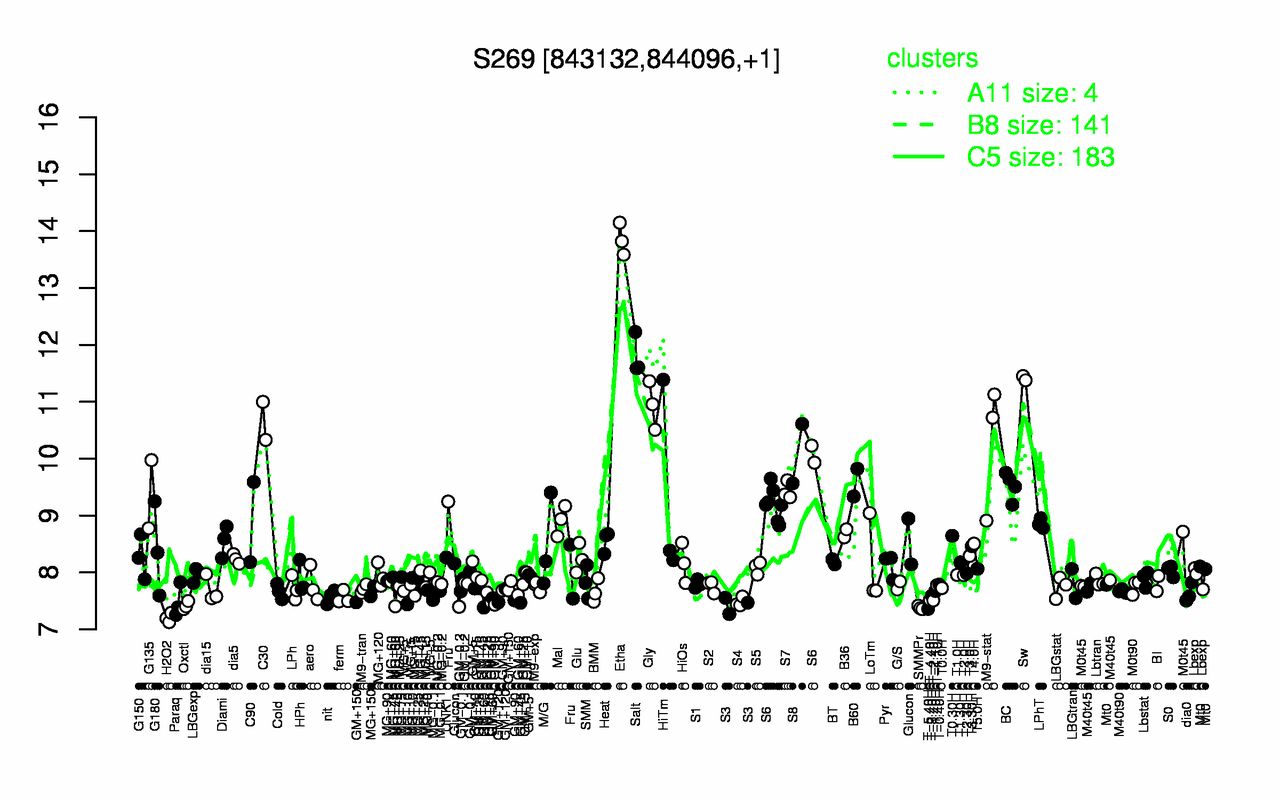
| Etha | Salt | Sw | Gly | C30 | M9-stat | S8 | B60 | BC | S7 |
| 13.9 | 11.8 | 11.4 | 10.9 | 10.7 | 10.3 | 10.1 | 9.58 | 9.52 | 9.44 |
| H2O2 | T-5.40H | SMMPr | Oxctl | S3 | S4 | Paraq | T-2.40H | GM+60 | T-4.40H |
| 7.2 | 7.36 | 7.38 | 7.42 | 7.43 | 7.48 | 7.49 | 7.51 | 7.51 | 7.52 |