| Start Page |
|
 |
| Start Page |
|
|
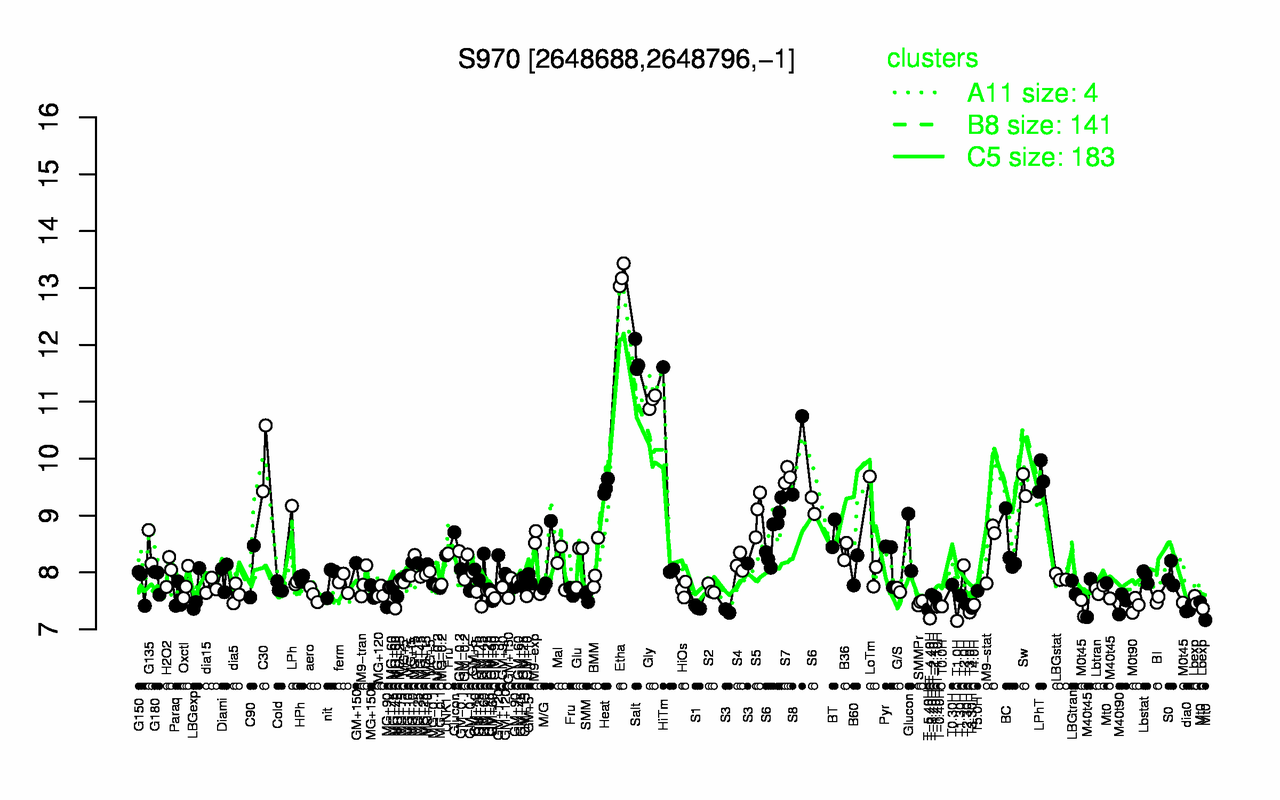
| Etha | Salt | Gly | S8 | C30 | S7 | LPhT | Sw | Heat | HiTm |
| 13.2 | 11.8 | 11 | 10.1 | 10 | 9.7 | 9.66 | 9.54 | 9.5 | 9.22 |
| T1.0H | T-4.40H | T3.0H | T-5.40H | dia0 | T3.30H | S1 | T-1.10H | T0.0H | M0t45 |
| 7.15 | 7.19 | 7.3 | 7.35 | 7.36 | 7.37 | 7.39 | 7.4 | 7.4 | 7.4 |