| Start Page |
|
 |
| Start Page |
|
|
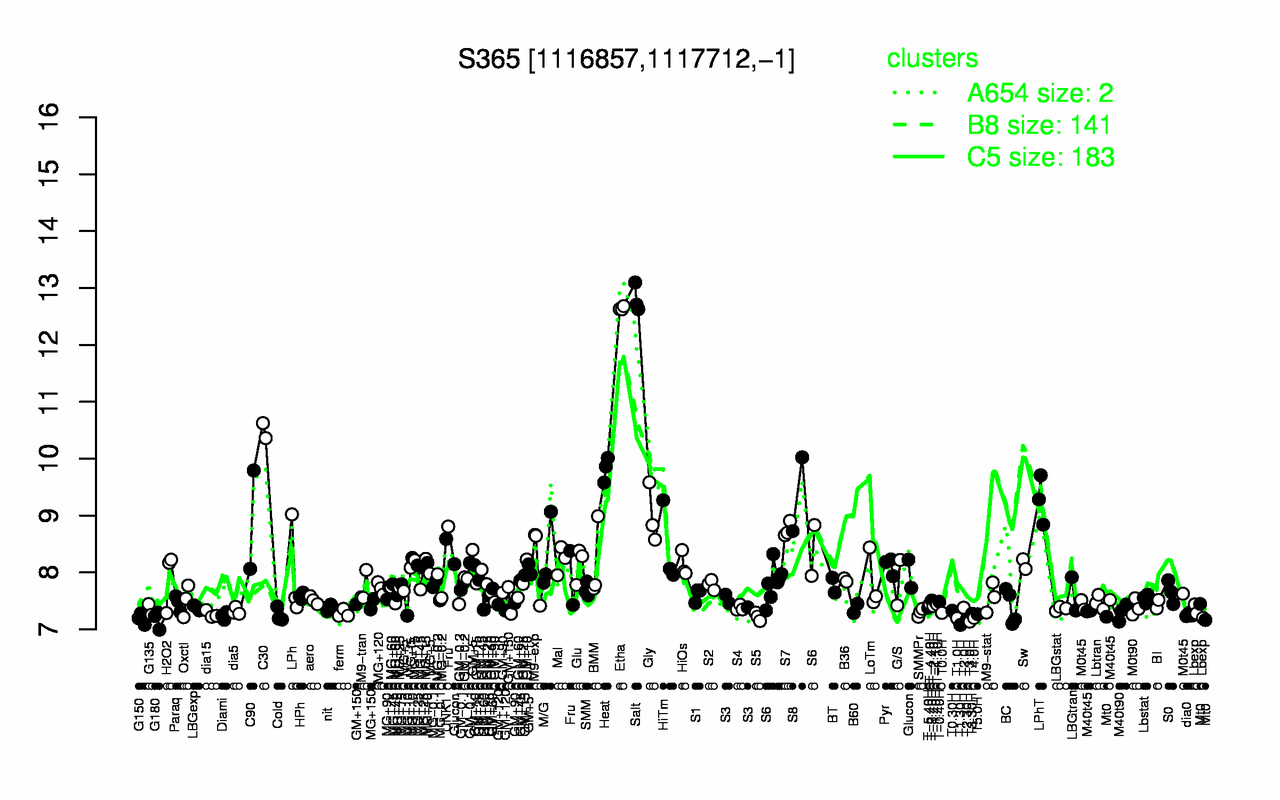
| Salt | Etha | C30 | Heat | S8 | LPhT | Gly | C90 | S7 | UNK1 |
| 12.8 | 12.6 | 10.5 | 9.82 | 9.38 | 9.28 | 9 | 8.93 | 8.75 | 8.59 |
| T1.30H | T3.0H | T2.30H | G180 | G150 | T1.0H | T4.0H | S5 | Diami | dia0 |
| 7.08 | 7.14 | 7.17 | 7.18 | 7.19 | 7.2 | 7.2 | 7.22 | 7.24 | 7.25 |