| Start Page |
|
 |
| Start Page |
|
|
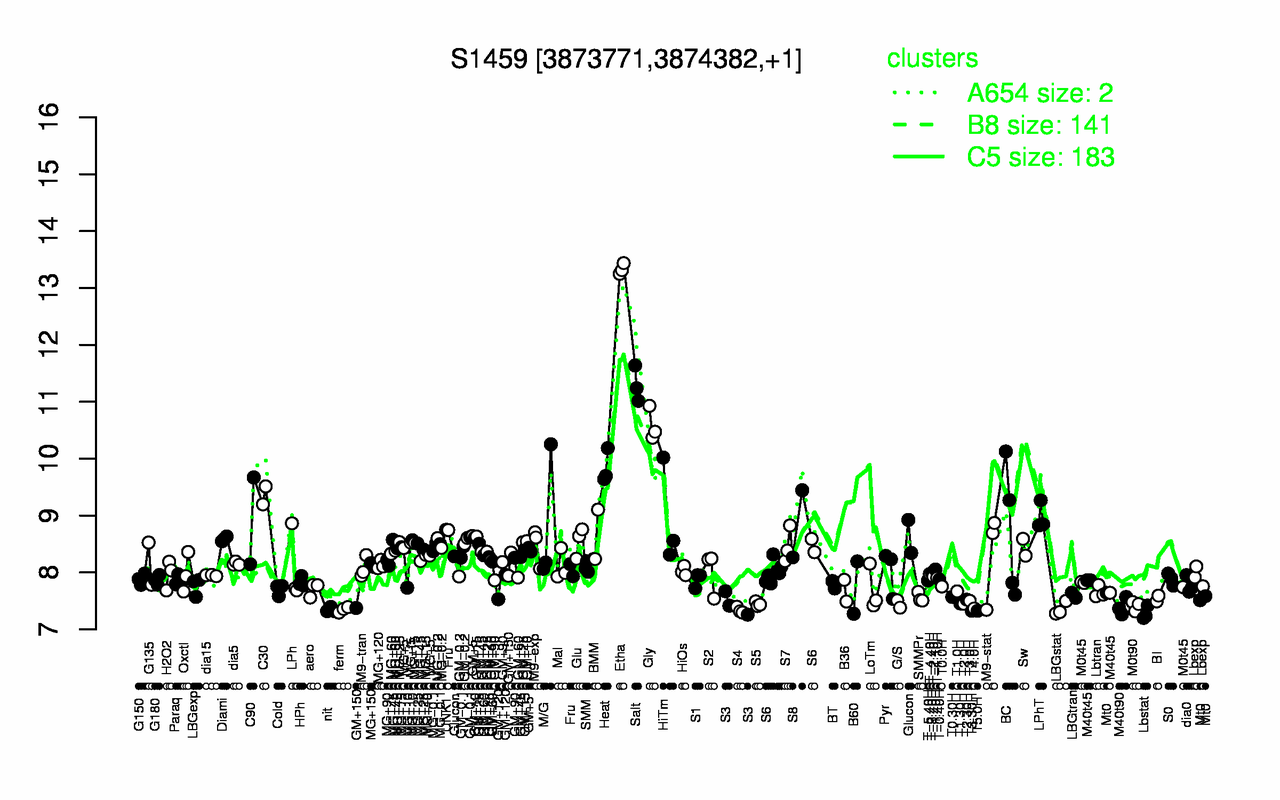
| Etha | Salt | Gly | Heat | C30 | LPhT | HiTm | C90 | S8 | M/G |
| 13.3 | 11.3 | 10.6 | 9.84 | 9.35 | 8.98 | 8.96 | 8.91 | 8.85 | 8.83 |
| Lbstat | T5.0H | T3.30H | S4 | nit | ferm | LBGstat | T4.0H | M40t90 | M0t90 |
| 7.28 | 7.33 | 7.33 | 7.34 | 7.34 | 7.35 | 7.36 | 7.37 | 7.4 | 7.41 |