B. subtilis Expression Data Browser
Details about endB Show/Hide
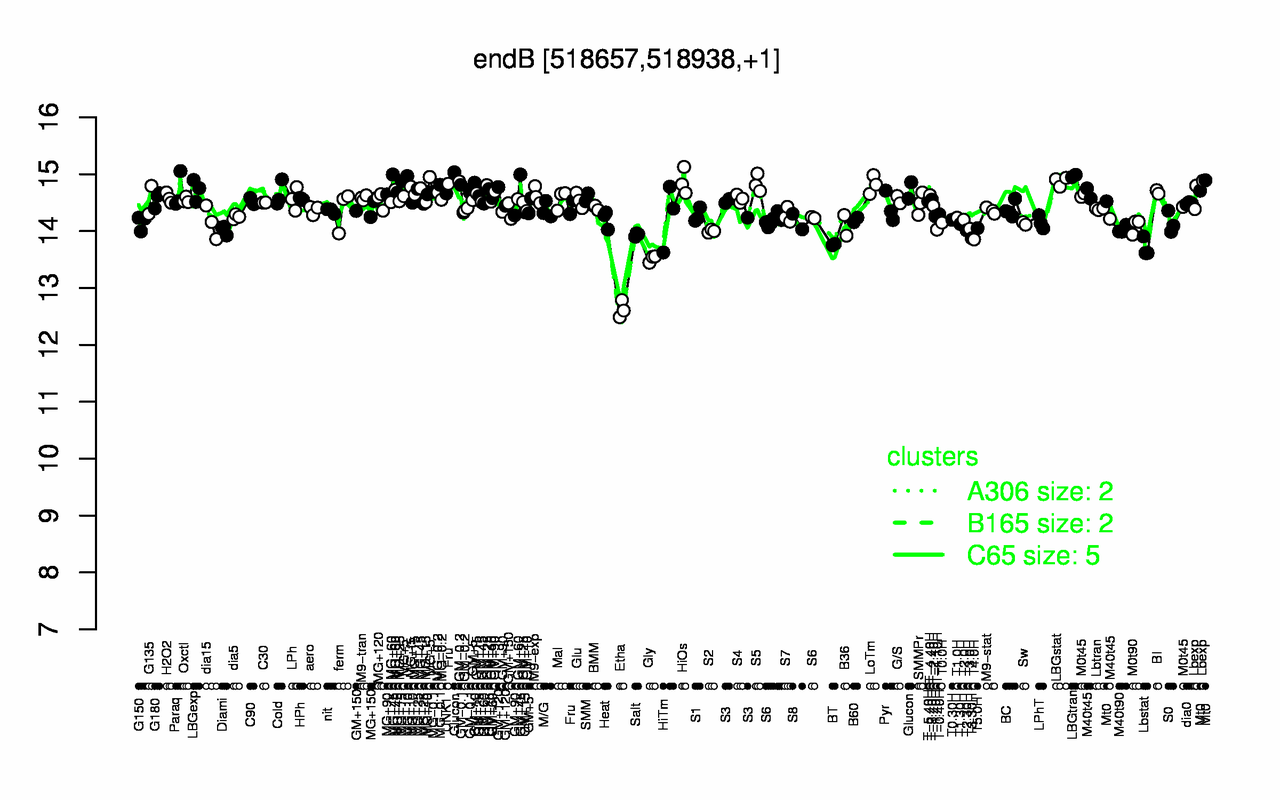
Highest Expression Conditions
LBGtran LBGstat HiOs S5 Glucon LoTm MG+45 MG+5 MG+t5 MG-0.1
15 14.9 14.9 14.8 14.8 14.8 14.8 14.8 14.8 14.7
Lowest Expression Conditions
Etha Gly Lbstat BT T4.0H T3.30H Salt S2 T2.30H Diami
12.6 13.5 13.7 13.8 13.9 13.9 13.9 14 14 14
Most Positively Correlated Segments
ndoA pyrR uppS ylxS rpoE NA ywnH ylbN S557 S593
0.9 0.61 0.61 0.61 0.6 0.6 0.59 0.58 0.58 0.57
Most Negatively Correlated Segments
S931 ydjJ S97 csbX S269 S1363 S1383 yuzH S1319 yugU
-0.6 -0.59 -0.58 -0.58 -0.58 -0.58 -0.57 -0.57 -0.56 -0.56
Expression Profile of Segment endB Show/Hide
Annotation of Gene endB Show/Hide
function
16.3: Control
function
16.5: Explore
inference
ab initio prediction:AMIGene:2.0
codon_start
1
product
antitoxin MazF
transl_table
11
note
Evidence 1a: Function experimentally demonstrated in the studied strain; PubMedId: 15882409; Product type r: regulator
db_xref
GI:2632765
protein_id
CAB12272.1
Genomic View of Gene/Segment endB Show/Hide
(Legend)