| Start Page |
|
 |
| Start Page |
|
|
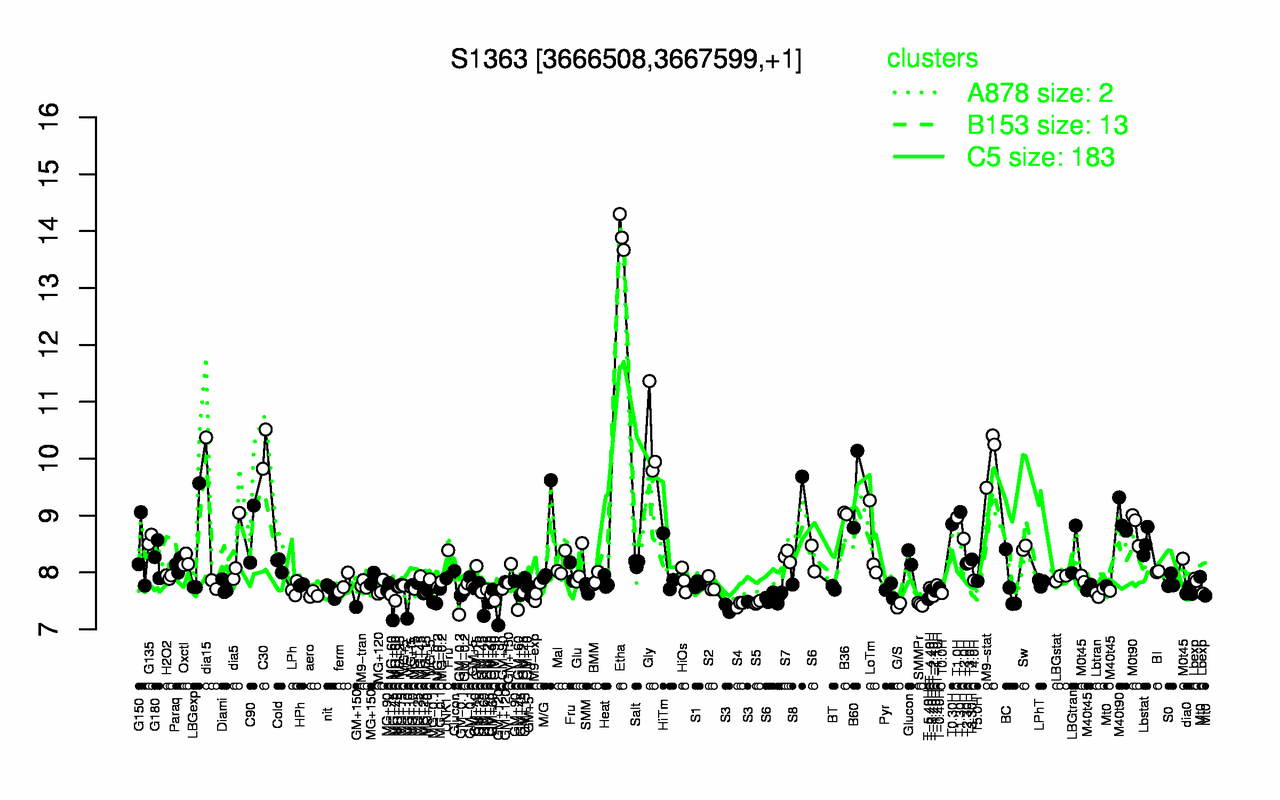
| Etha | Gly | C30 | M9-stat | B60 | T1.30H | B36 | T1.0H | M40t90 | T0.30H |
| 14 | 10.4 | 10.2 | 10 | 9.46 | 9.06 | 9.04 | 8.97 | 8.96 | 8.85 |
| S3 | G/S | GM+60 | S4 | SMMPr | GM+120 | S5 | T-5.40H | MG-0.1 | MG+10 |
| 7.41 | 7.42 | 7.42 | 7.44 | 7.44 | 7.45 | 7.47 | 7.53 | 7.55 | 7.55 |