| Start Page |
|
 |
| Start Page |
|
|
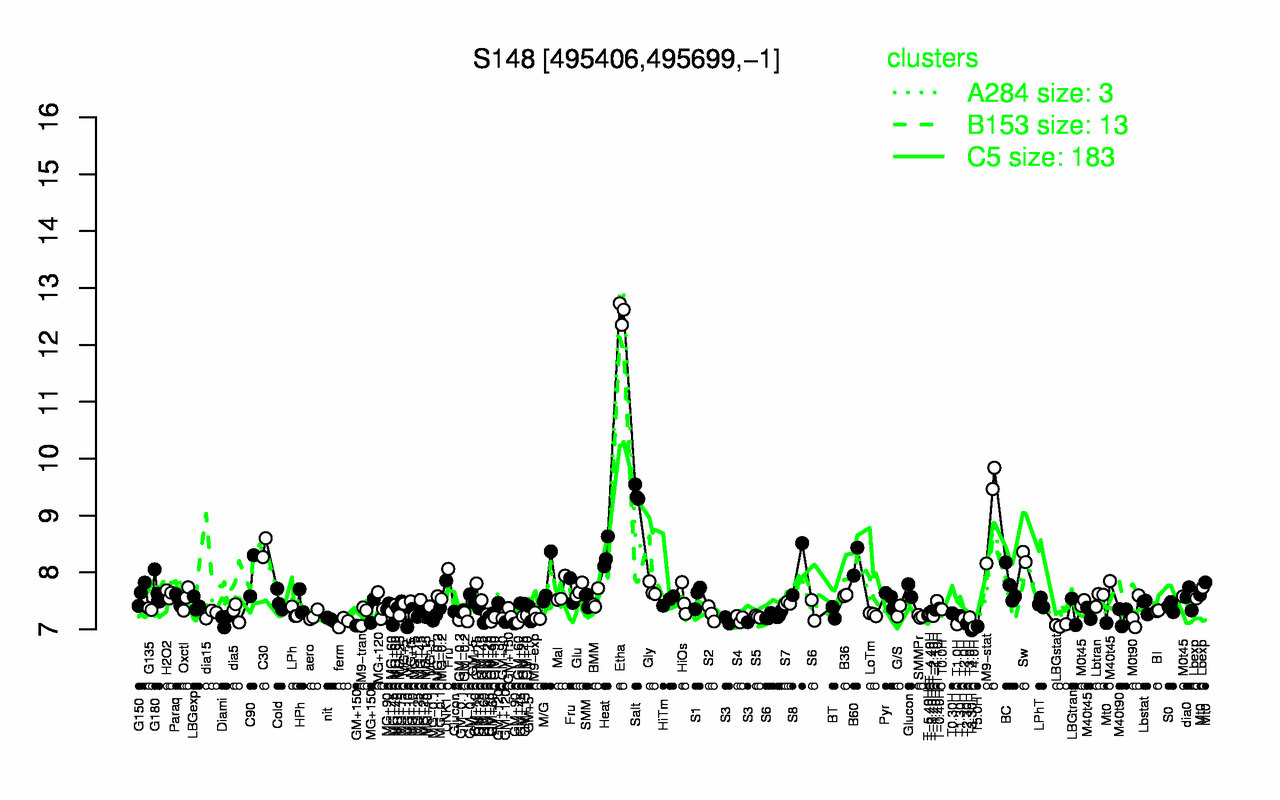
| Etha | Salt | M9-stat | C30 | Heat | Sw | B60 | S8 | C90 | UNK1 |
| 12.6 | 9.39 | 9.15 | 8.44 | 8.32 | 8.27 | 8.19 | 8.06 | 7.94 | 7.86 |
| T3.30H | T4.0H | T5.0H | LBGstat | T1.0H | T2.30H | ferm | S3 | Diami | GM+90 |
| 6.98 | 7.04 | 7.05 | 7.07 | 7.09 | 7.1 | 7.13 | 7.15 | 7.16 | 7.17 |