| Start Page |
|
 |
| Start Page |
|
|
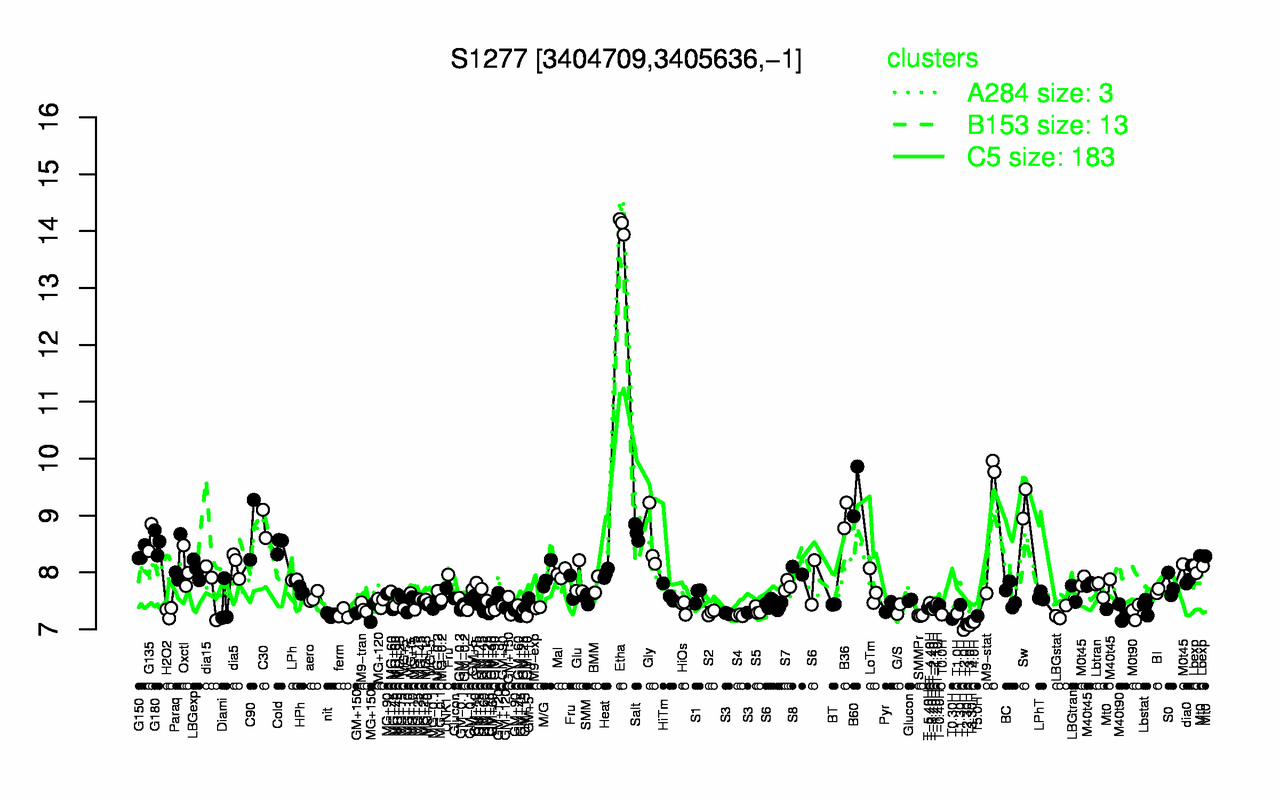
| Etha | B60 | Sw | M9-stat | B36 | C30 | C90 | Salt | G135 | Gly |
| 14.1 | 9.42 | 9.21 | 9.12 | 9 | 8.85 | 8.75 | 8.7 | 8.61 | 8.56 |
| T2.0H | T3.0H | T2.30H | T4.0H | T3.30H | T0.30H | T5.0H | SMMPr | S4 | nit |
| 6.99 | 7.07 | 7.08 | 7.13 | 7.13 | 7.18 | 7.23 | 7.24 | 7.25 | 7.25 |