| Start Page |
|
 |
| Start Page |
|
|
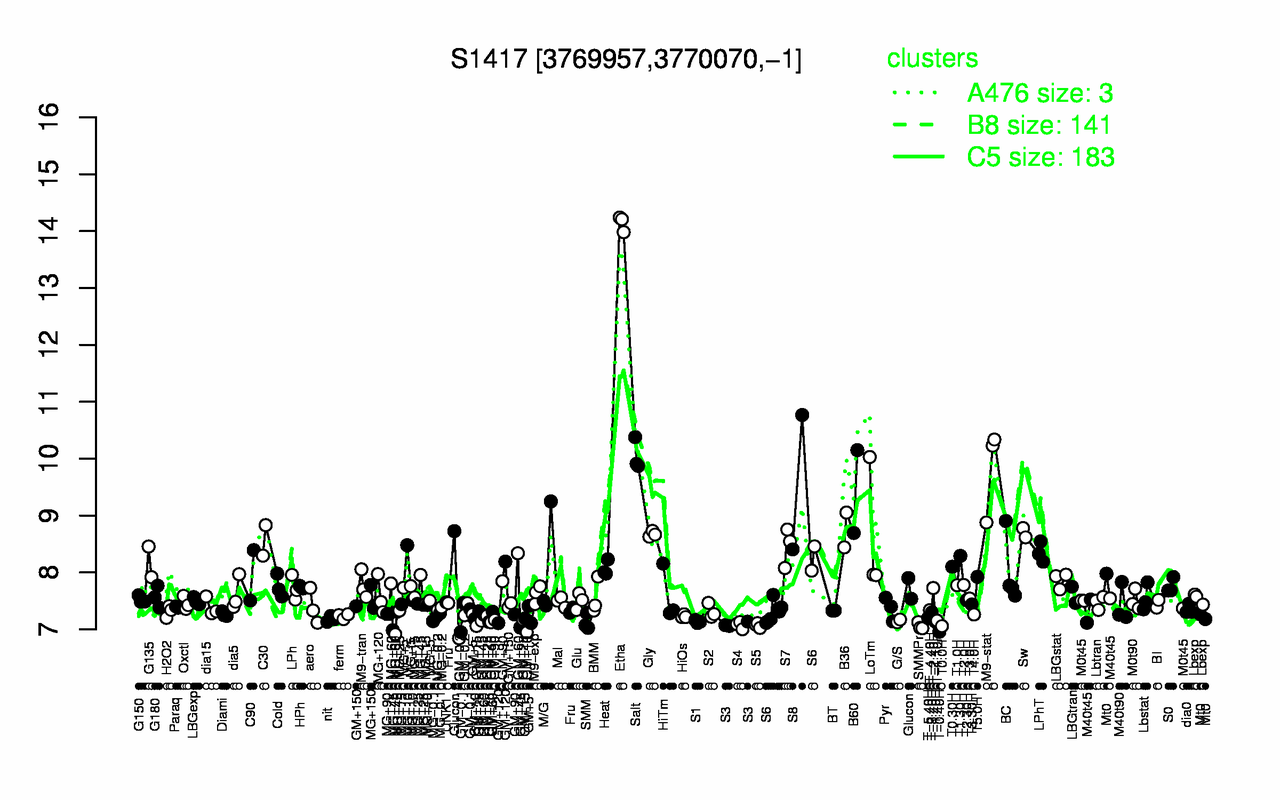
| Etha | Salt | M9-stat | S8 | B60 | B36 | Sw | Gly | LoTm | C30 |
| 14.1 | 10.1 | 9.81 | 9.59 | 9.42 | 8.75 | 8.7 | 8.67 | 8.65 | 8.56 |
| T-0.40H | T0.0H | SMMPr | GM+10 | S5 | S4 | S3 | GM+45 | GM+15 | SMM |
| 6.96 | 7.06 | 7.06 | 7.07 | 7.07 | 7.07 | 7.09 | 7.1 | 7.13 | 7.13 |