| Start Page |
|
 |
| Start Page |
|
|
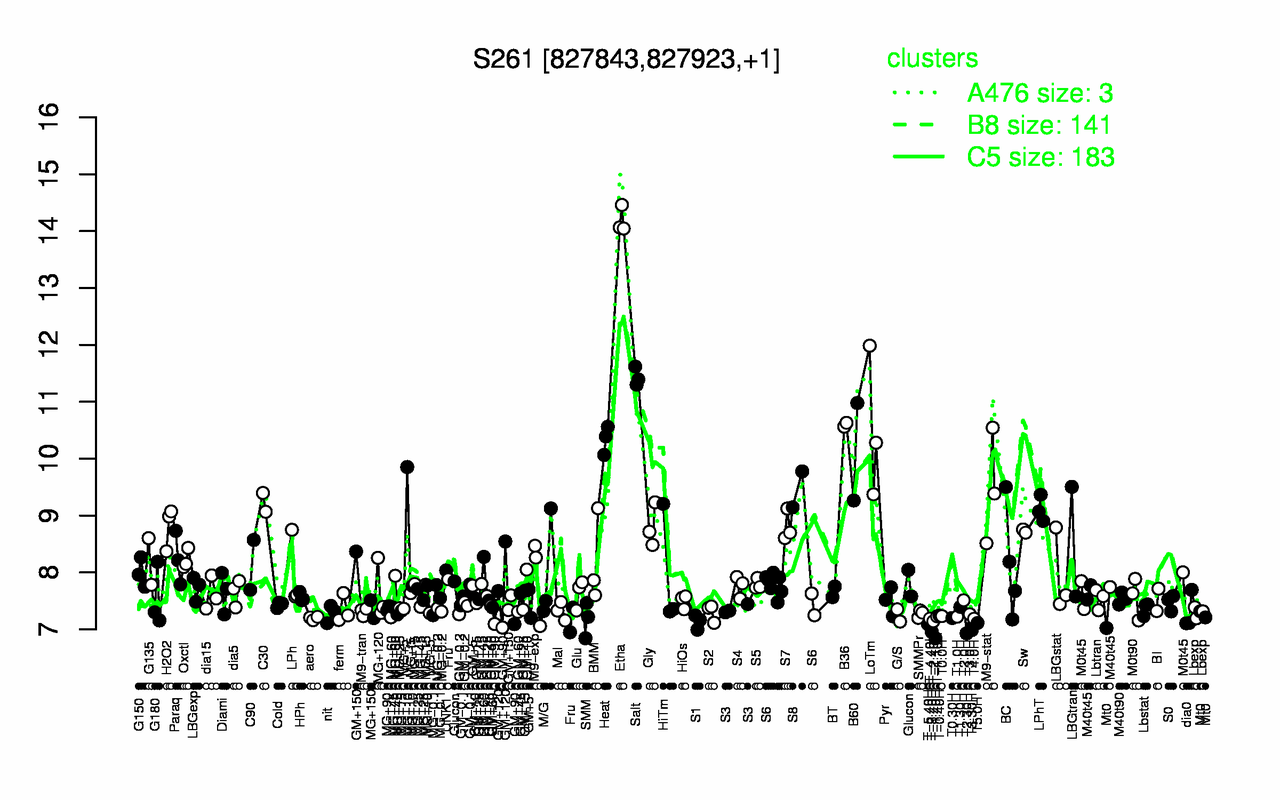
| Etha | Salt | B36 | LoTm | Heat | B60 | M9-stat | S8 | C30 | LPhT |
| 14.2 | 11.4 | 10.6 | 10.5 | 10.3 | 10.1 | 9.48 | 9.46 | 9.23 | 9.11 |
| T-1.40H | T2.30H | T-3.40H | T3.30H | GM+90 | T-5.40H | T5.0H | S1 | T-2.40H | SMM |
| 6.84 | 6.93 | 6.96 | 6.99 | 7.07 | 7.09 | 7.11 | 7.13 | 7.14 | 7.18 |