| Start Page |
|
 |
| Start Page |
|
|
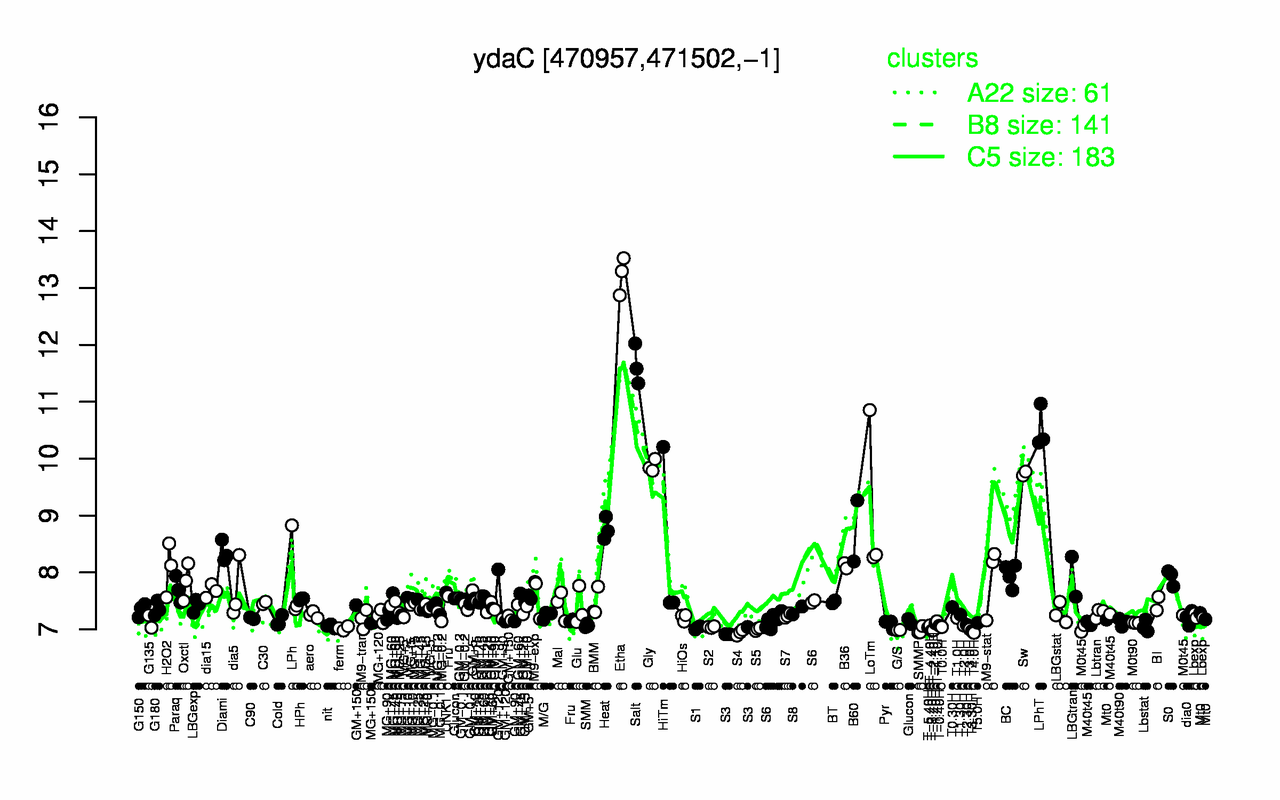
| Etha | Salt | LPhT | Gly | Sw | LoTm | Heat | B60 | HiTm | Diami |
| 13.2 | 11.6 | 10.5 | 9.87 | 9.74 | 9.14 | 8.76 | 8.73 | 8.38 | 8.36 |
| T4.0H | S4 | S3 | T3.30H | T-3.40H | T-2.40H | SMMPr | G/S | S5 | T3.0H |
| 6.94 | 6.94 | 6.96 | 6.97 | 6.98 | 6.98 | 6.98 | 6.99 | 7 | 7.01 |