| Start Page |
|
 |
| Start Page |
|
|
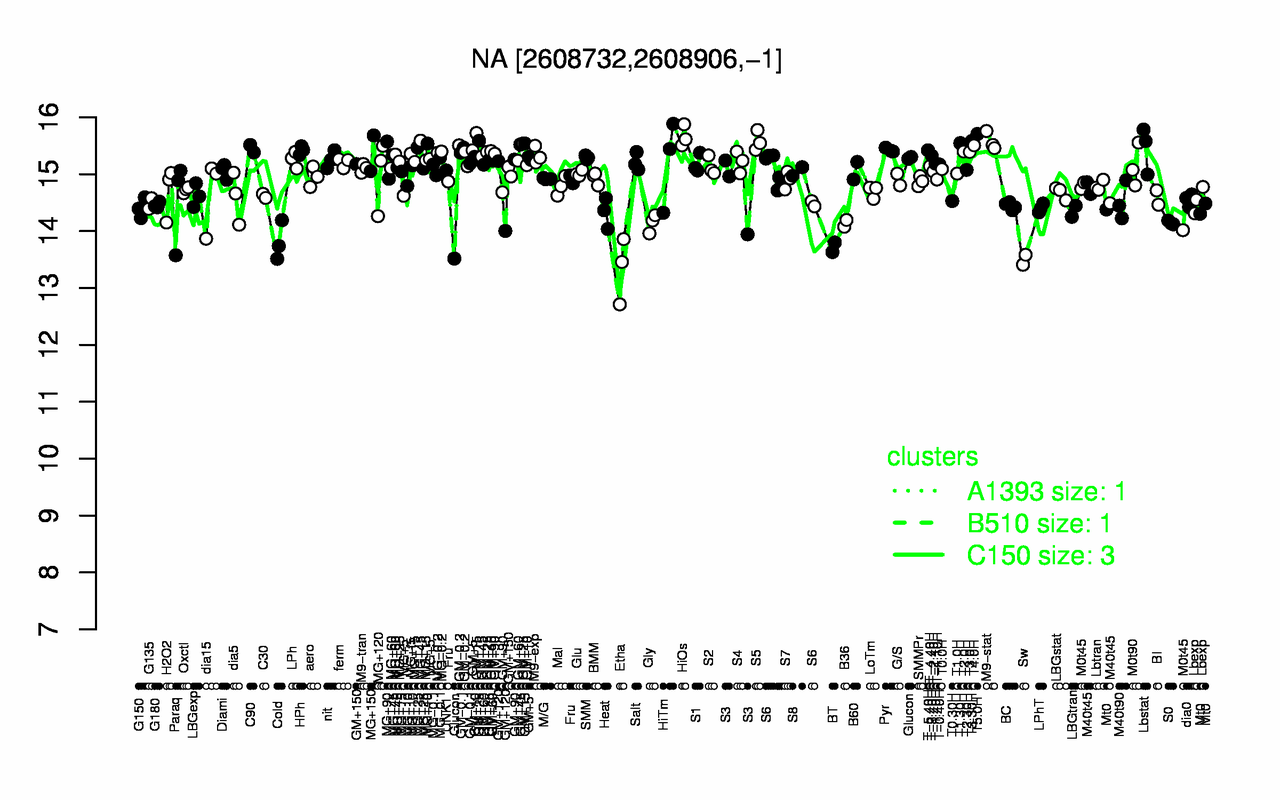
| T5.0H | HiOs | S5 | T3.30H | M9-stat | T1.30H | T4.0H | GM+25 | GM+15 | Lbstat |
| 15.7 | 15.7 | 15.6 | 15.6 | 15.6 | 15.5 | 15.5 | 15.5 | 15.5 | 15.5 |
| Etha | Sw | BT | Cold | B36 | Gly | S0 | Heat | LBGtran | Mt0 |
| 13.3 | 13.5 | 13.7 | 13.8 | 14.1 | 14.1 | 14.1 | 14.3 | 14.3 | 14.4 |