| Start Page |
|
 |
| Start Page |
|
|
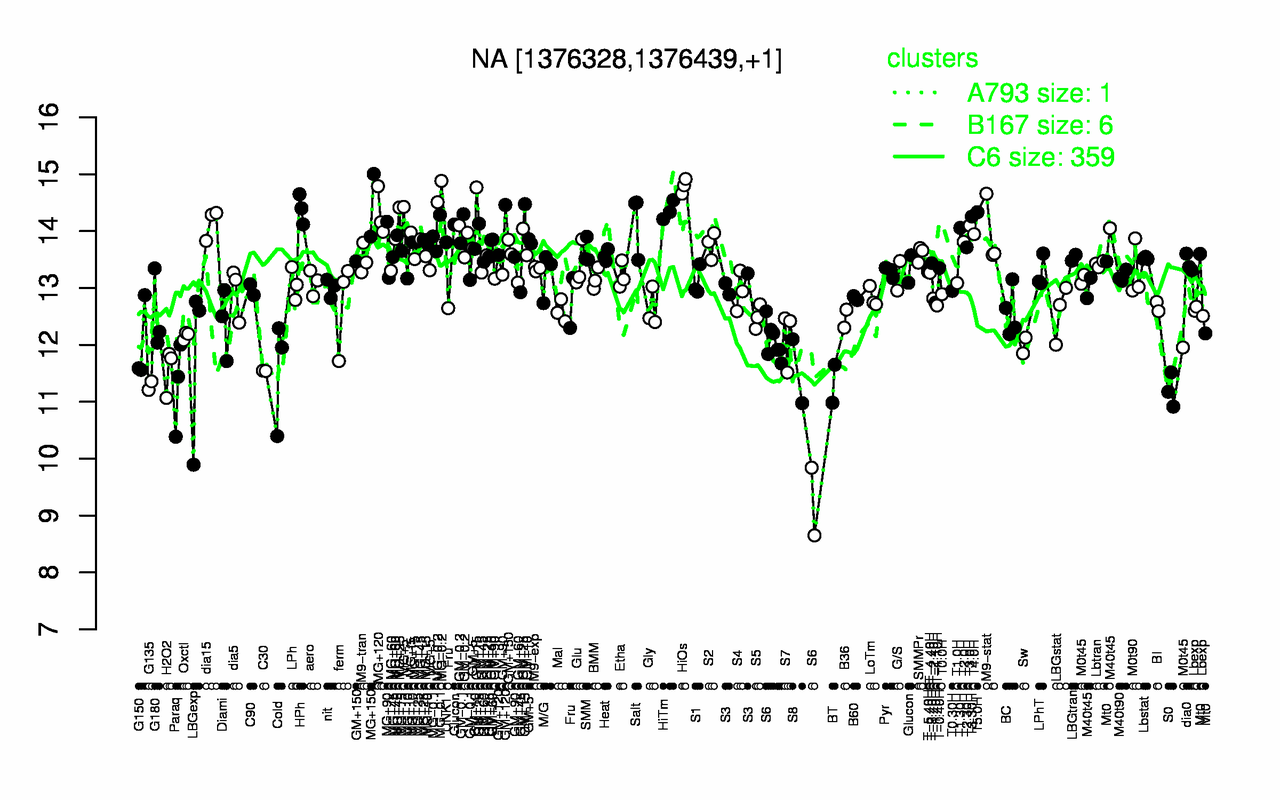
| HiOs | MG-0.2 | MG+150 | HPh | HiTm | T5.0H | MG+120 | GM+15 | T3.30H | Salt |
| 14.8 | 14.7 | 14.5 | 14.4 | 14.4 | 14.3 | 14.3 | 14.3 | 14.3 | 14.2 |
| S0 | Paraq | G135 | BT | S6 | S8 | C30 | Cold | H2O2 | LBGexp |
| 11.2 | 11.3 | 11.3 | 11.3 | 11.4 | 11.5 | 11.5 | 11.5 | 11.6 | 11.8 |