| Start Page |
|
 |
| Start Page |
|
|
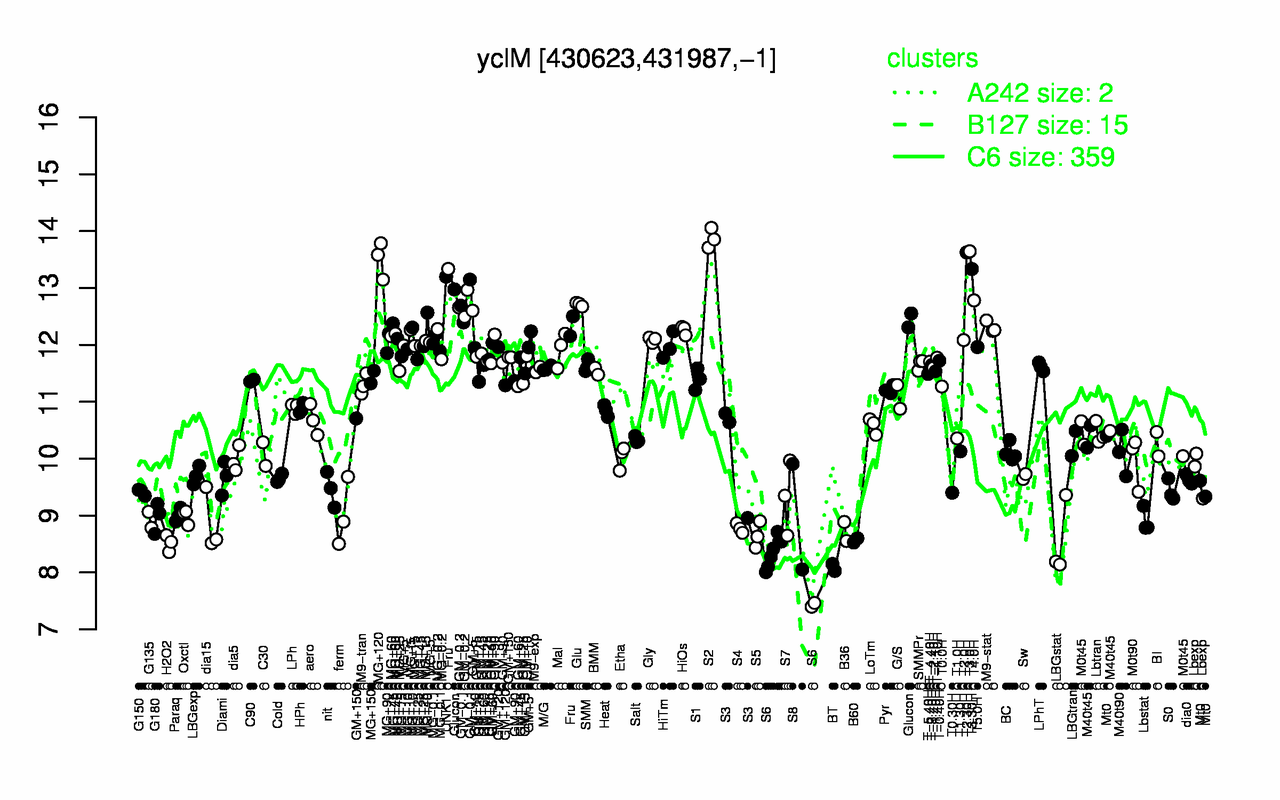
| S2 | T3.0H | T2.30H | MG+120 | T3.30H | UNK1 | T4.0H | GM-0.1 | Glu | GM-0.2 |
| 13.9 | 13.6 | 13.6 | 13.5 | 13.3 | 13.2 | 12.8 | 12.7 | 12.7 | 12.7 |
| BT | S6 | H2O2 | B60 | LBGstat | S5 | B36 | S4 | dia15 | Lbstat |
| 8.09 | 8.16 | 8.52 | 8.56 | 8.56 | 8.66 | 8.72 | 8.78 | 8.87 | 8.92 |