| Start Page |
|
 |
| Start Page |
|
|
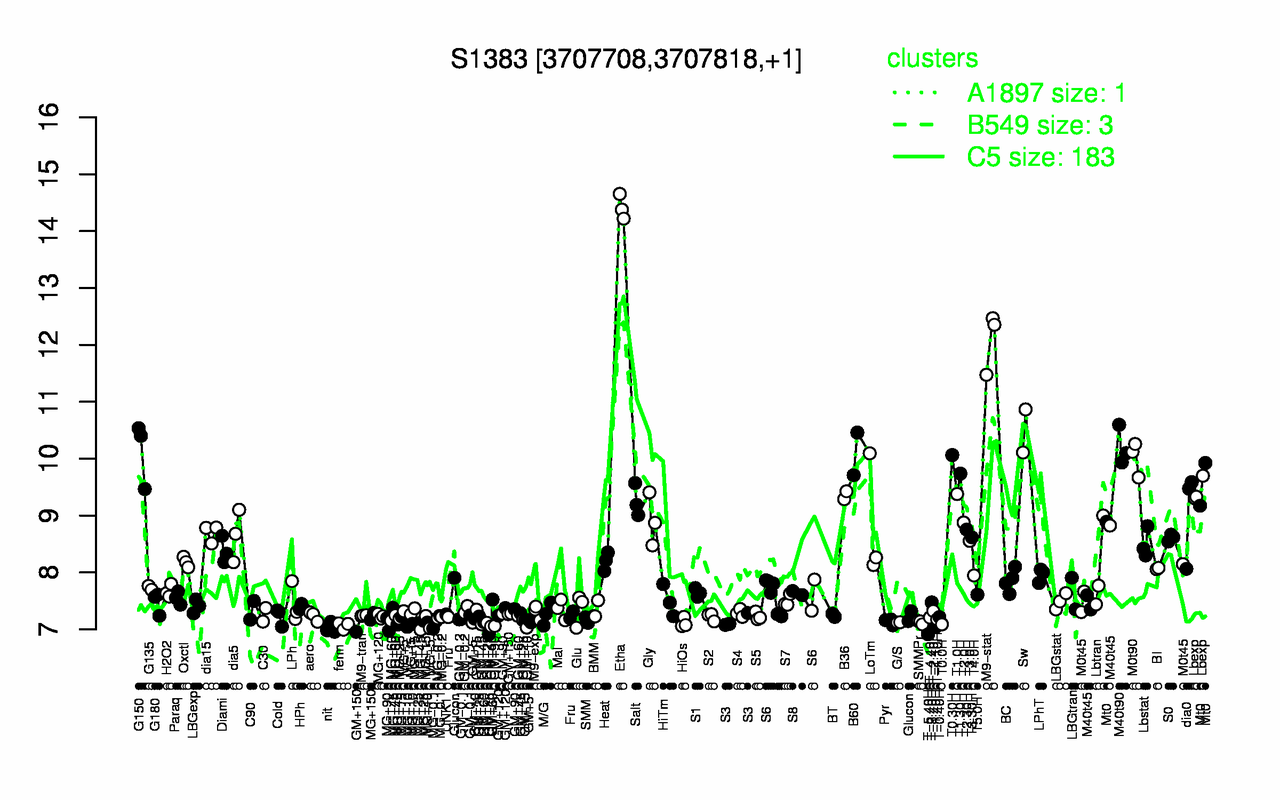
| Etha | M9-stat | Sw | M40t90 | G150 | B60 | T0.30H | M0t90 | T1.30H | Lbexp |
| 14.4 | 12.1 | 10.5 | 10.2 | 10.1 | 10.1 | 10.1 | 10 | 9.74 | 9.45 |
| T-5.40H | nit | T-1.40H | ferm | MG+90 | T0.0H | MG+10 | GM+10 | HiOs | G/S |
| 6.91 | 7.02 | 7.04 | 7.06 | 7.09 | 7.09 | 7.09 | 7.11 | 7.12 | 7.12 |