| Start Page |
|
 |
| Start Page |
|
|
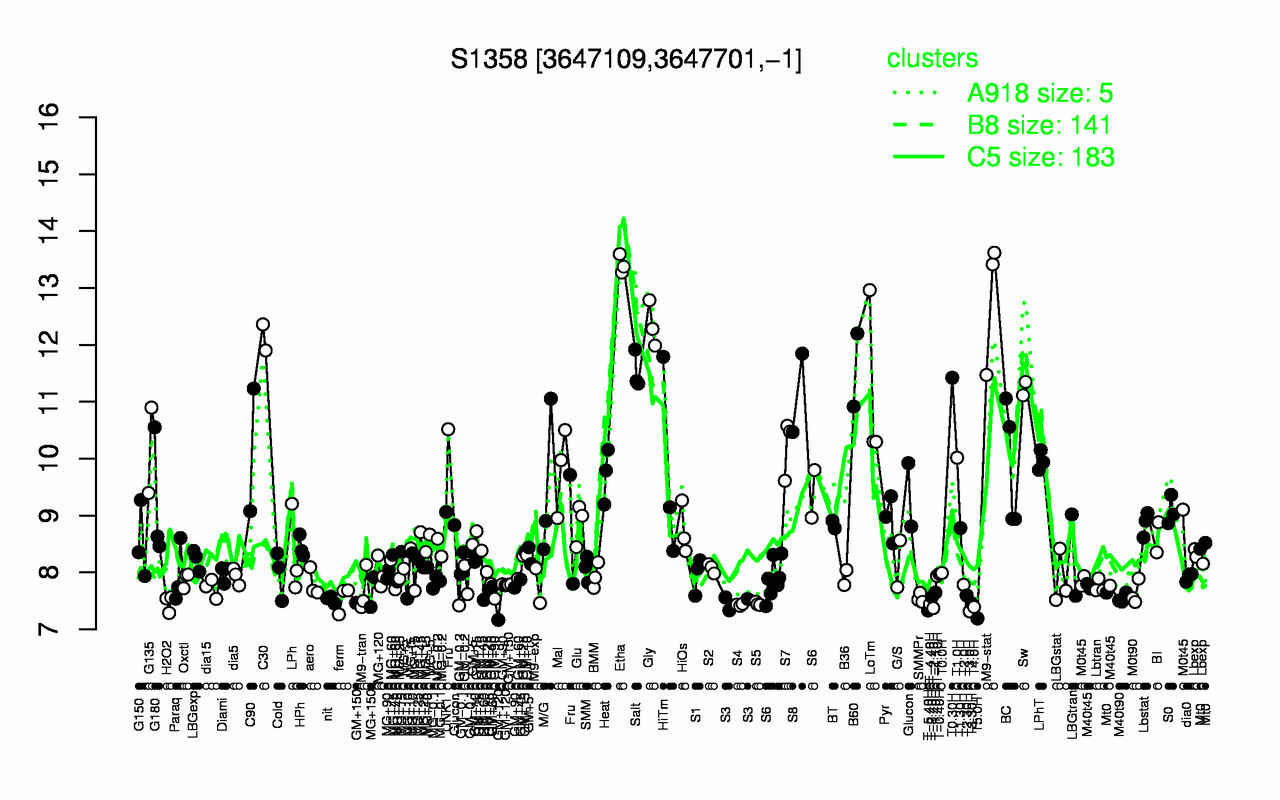
| Etha | M9-stat | Gly | C30 | B60 | Salt | T0.30H | Sw | LoTm | S8 |
| 13.4 | 12.8 | 12.4 | 12.1 | 11.6 | 11.5 | 11.4 | 11.2 | 11.2 | 11.2 |
| T5.0H | T3.0H | T-5.40H | T-2.40H | T4.0H | S4 | T-4.40H | S5 | T3.30H | H2O2 |
| 7.19 | 7.32 | 7.33 | 7.37 | 7.39 | 7.43 | 7.45 | 7.45 | 7.45 | 7.46 |