| Start Page |
|
 |
| Start Page |
|
|
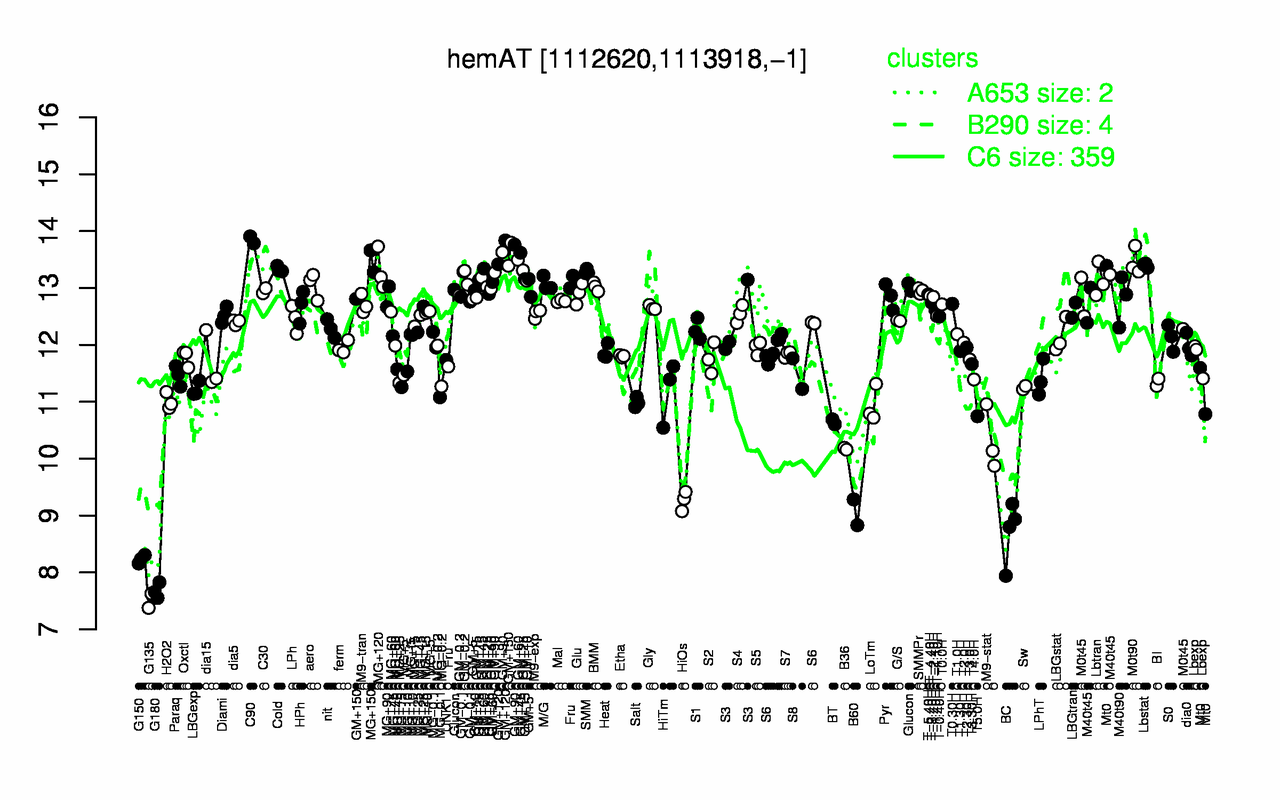
| C90 | GM+120 | GM+90 | MG+150 | M0t90 | Lbstat | GM+150 | Cold | MG+120 | GM+60 |
| 13.8 | 13.6 | 13.6 | 13.5 | 13.5 | 13.4 | 13.3 | 13.3 | 13.3 | 13.3 |
| G135 | G180 | G150 | BC | B60 | HiOs | B36 | M9-stat | BT | T5.0H |
| 7.5 | 7.68 | 8.23 | 8.72 | 9.06 | 9.26 | 10.2 | 10.3 | 10.6 | 10.7 |