| Start Page |
|
 |
| Start Page |
|
|
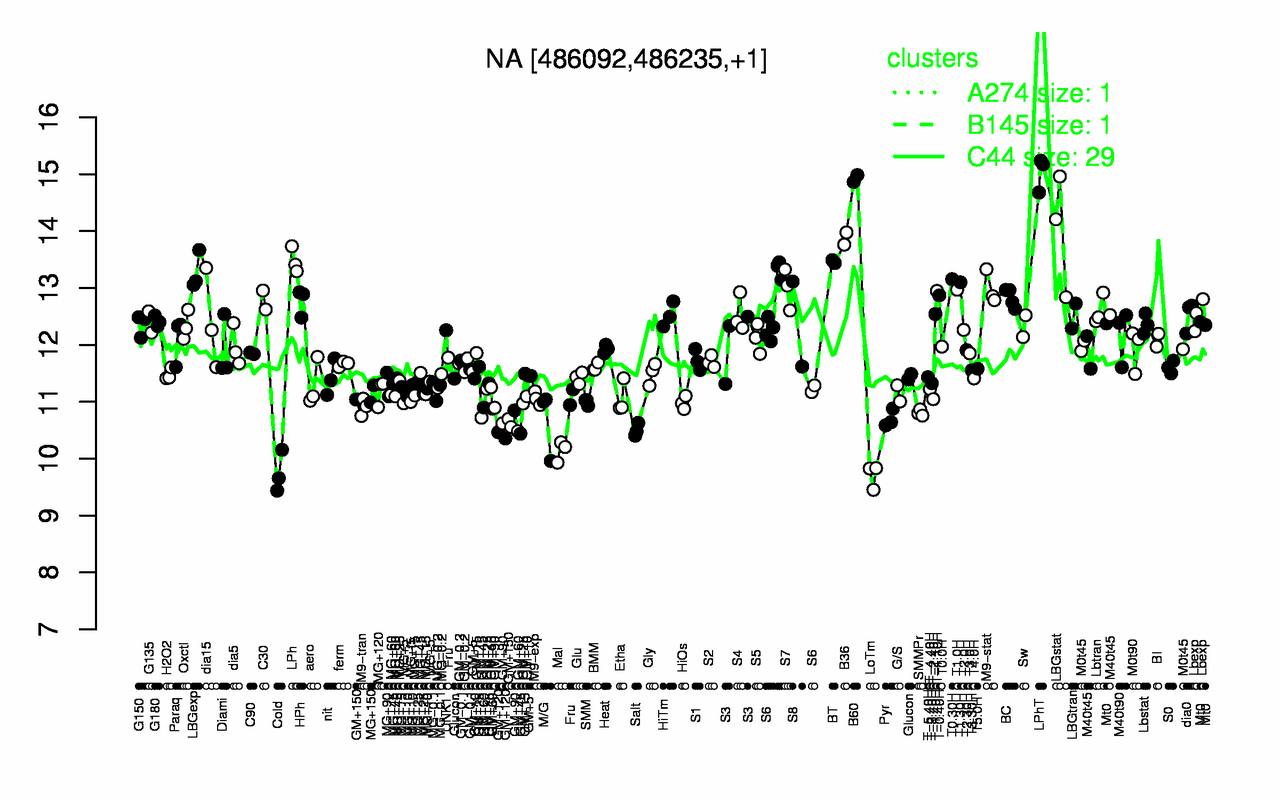
| LPhT | B60 | LBGstat | B36 | LPh | BT | LBGexp | T0.30H | T1.30H | S7 |
| 15 | 14.9 | 14 | 13.9 | 13.5 | 13.5 | 13.3 | 13.2 | 13.1 | 13 |
| LoTm | Cold | Mal | GM+120 | Salt | M/G | Pyr | GM+60 | GM+150 | GM+90 |
| 9.7 | 9.75 | 10.1 | 10.4 | 10.5 | 10.7 | 10.7 | 10.8 | 10.8 | 10.8 |