| Start Page |
|
 |
| Start Page |
|
|
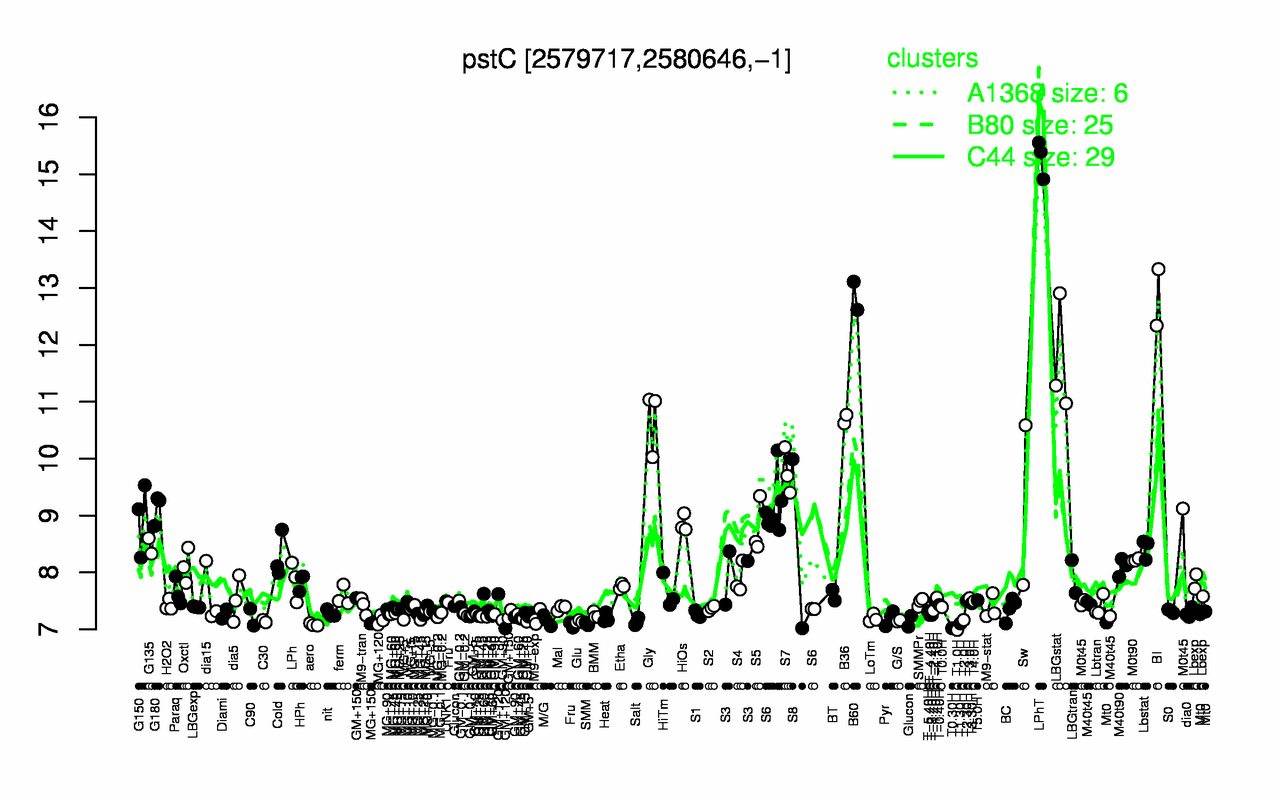
| LPhT | B60 | BI | LBGstat | B36 | Gly | S7 | Sw | G180 | G150 |
| 15.3 | 12.9 | 12.8 | 11.7 | 10.7 | 10.7 | 9.77 | 9.18 | 9.13 | 8.97 |
| T1.0H | T0.30H | aero | T1.30H | SMM | MG+150 | Salt | Glu | C30 | G/S |
| 6.99 | 7.02 | 7.08 | 7.1 | 7.1 | 7.11 | 7.13 | 7.14 | 7.14 | 7.15 |