| Start Page |
|
 |
| Start Page |
|
|
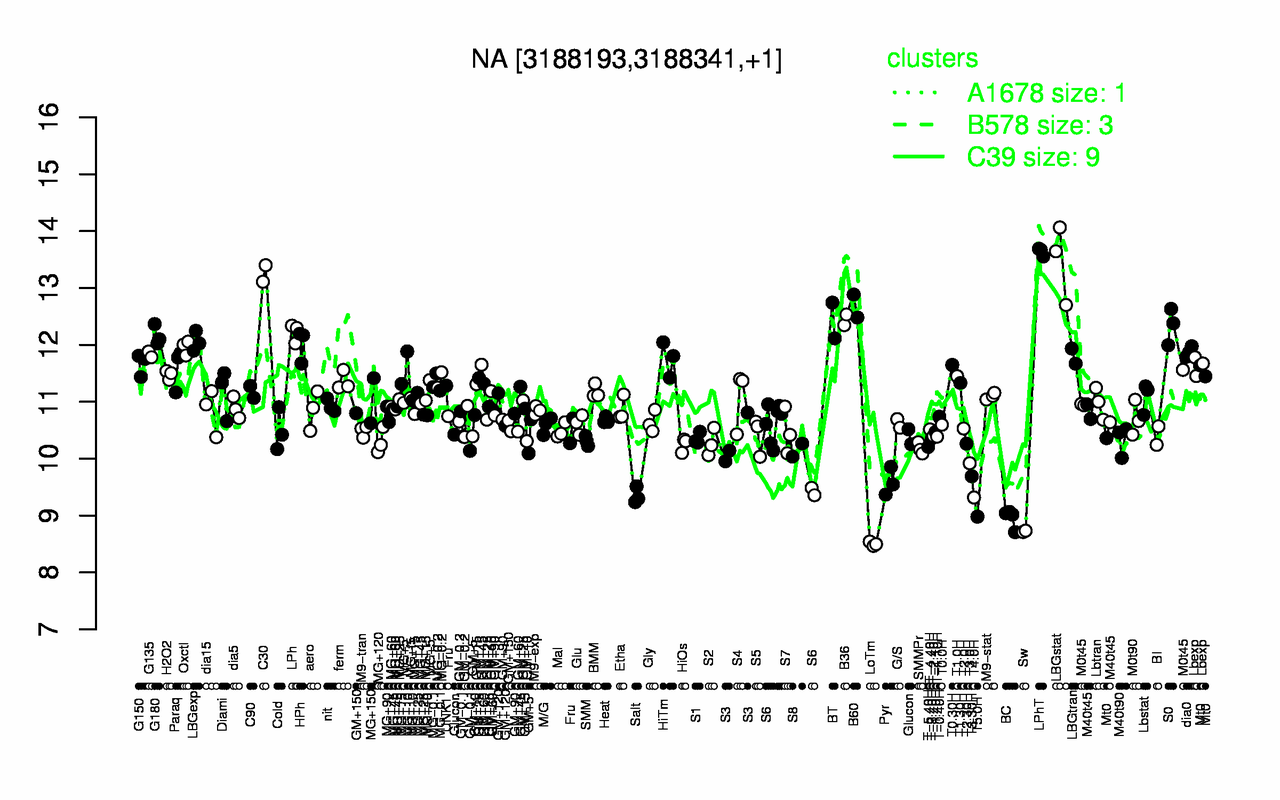
| LPhT | LBGstat | C30 | B60 | B36 | BT | S0 | LPh | G180 | LBGexp |
| 13.6 | 13.5 | 13.3 | 12.7 | 12.4 | 12.4 | 12.3 | 12.2 | 12.2 | 12.1 |
| LoTm | Sw | BC | T5.0H | T4.0H | Salt | Pyr | T3.30H | T3.0H | S8 |
| 8.5 | 8.72 | 8.96 | 8.98 | 9.32 | 9.35 | 9.59 | 9.69 | 9.92 | 10.2 |