| Start Page |
|
 |
| Start Page |
|
|
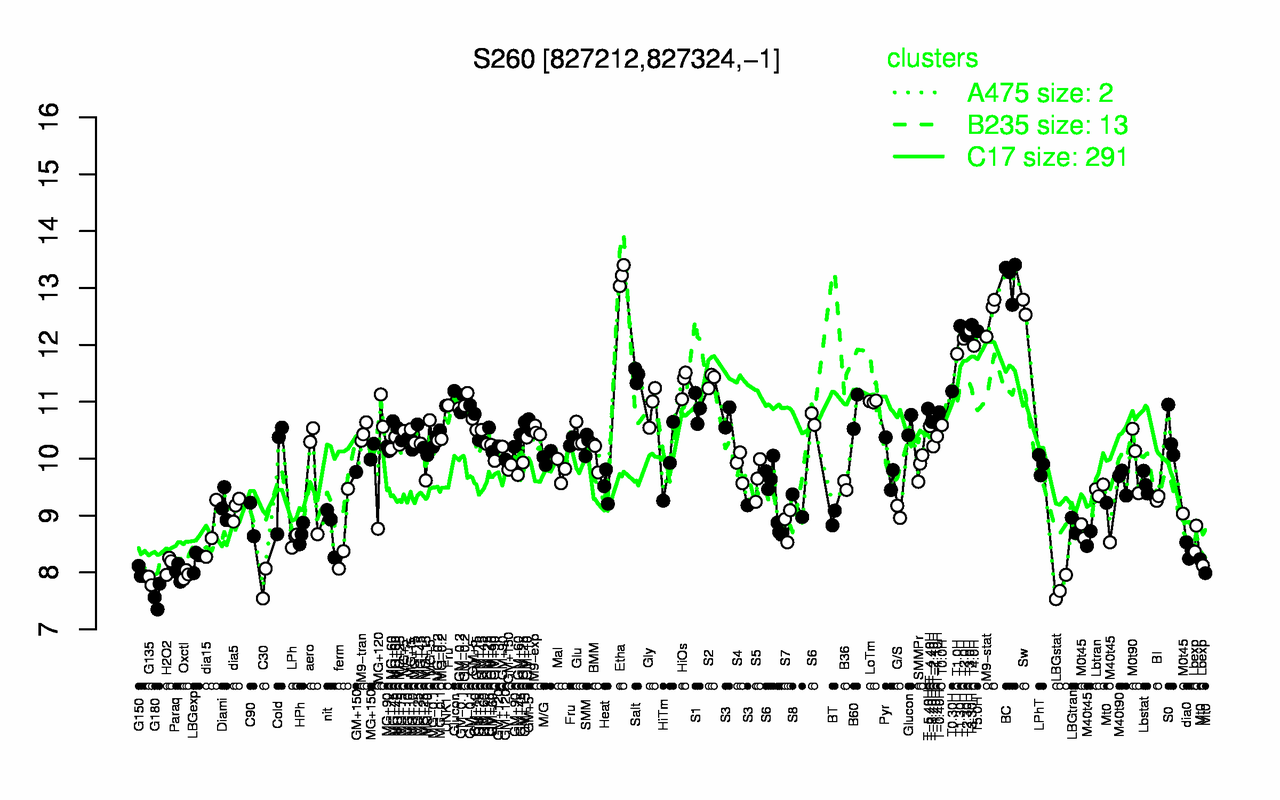
| Etha | BC | Sw | M9-stat | T3.30H | T1.30H | T3.0H | T5.0H | T2.30H | T2.0H |
| 13.2 | 13.2 | 12.7 | 12.5 | 12.3 | 12.3 | 12.3 | 12.2 | 12.2 | 12.1 |
| G180 | LBGstat | C30 | G135 | Oxctl | G150 | Paraq | H2O2 | LBGexp | dia0 |
| 7.57 | 7.72 | 7.8 | 7.85 | 7.96 | 8 | 8 | 8.14 | 8.21 | 8.39 |