B. subtilis Expression Data Browser
Start Page
B. subtilis Expression Data Browser
Gene/Segment:
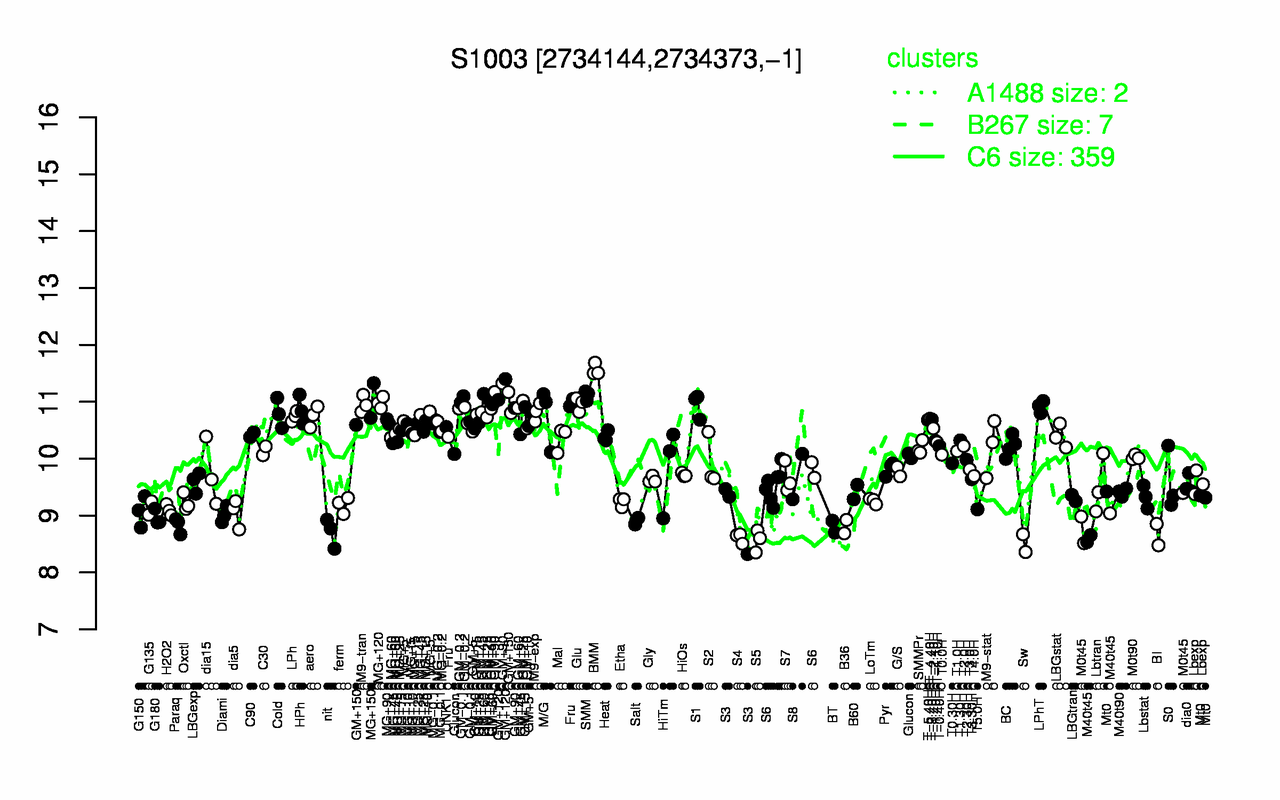
S1003
Locus Tag:
new_2734144_2734373_c
Details about S1003
Show/Hide
Highest Expression Conditions
BMM
GM+120
GM+90
SMM
MG+150
GM+60
MG+120
M9-tran
Glu
S1
11.6
11.2
11.1
11.1
11
11
11
11
11
10.9
Lowest Expression Conditions
Sw
S5
S4
BI
nit
M40t45
BT
B36
Paraq
Salt
8.52
8.56
8.61
8.67
8.7
8.74
8.8
8.81
8.83
8.91
Most Positively Correlated Segments
yrdB
yoyD
yqjY
S823
S93
S1292
yqjZ
yodF
ybgF
S689
0.9
0.71
0.7
0.7
0.7
0.69
0.69
0.68
0.68
0.68
Most Negatively Correlated Segments
ymfH
dtpT
ymfF
ytpA
yhaN
sspH
yrzF
S1120
cydC
ymfJ
-0.67
-0.63
-0.62
-0.57
-0.57
-0.57
-0.57
-0.57
-0.56
-0.56
Expression Profile of Segment S1003
Show/Hide
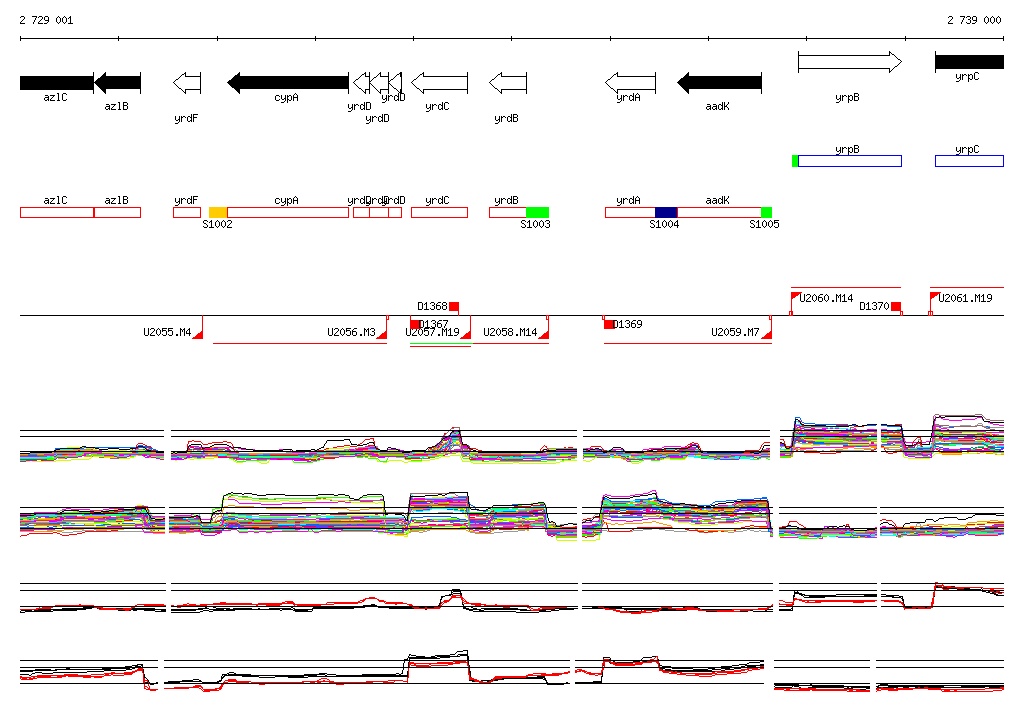
Genomic View of Gene/Segment S1003
Show/Hide
(Legend)
Browse Genome Context