| Start Page |
|
 |
| Start Page |
|
|
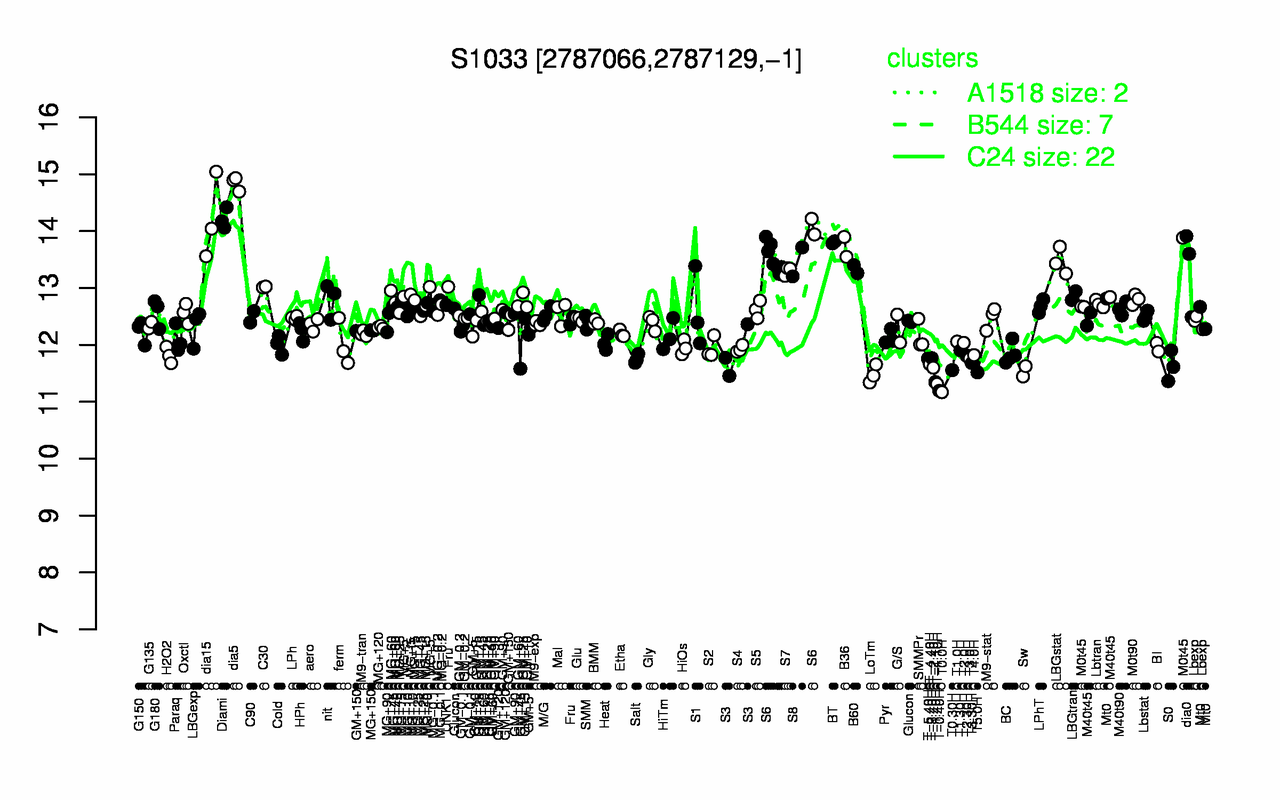
| dia5 | Diami | dia15 | BT | B36 | S6 | LBGstat | S8 | dia0 | B60 |
| 14.8 | 14.2 | 14.2 | 13.8 | 13.7 | 13.7 | 13.5 | 13.5 | 13.3 | 13.3 |
| T0.0H | T-0.40H | T-1.10H | T-1.40H | LoTm | T5.0H | Sw | T0.30H | T-2.40H | S0 |
| 11.2 | 11.2 | 11.3 | 11.3 | 11.5 | 11.5 | 11.5 | 11.6 | 11.6 | 11.6 |