| Start Page |
|
 |
| Start Page |
|
|
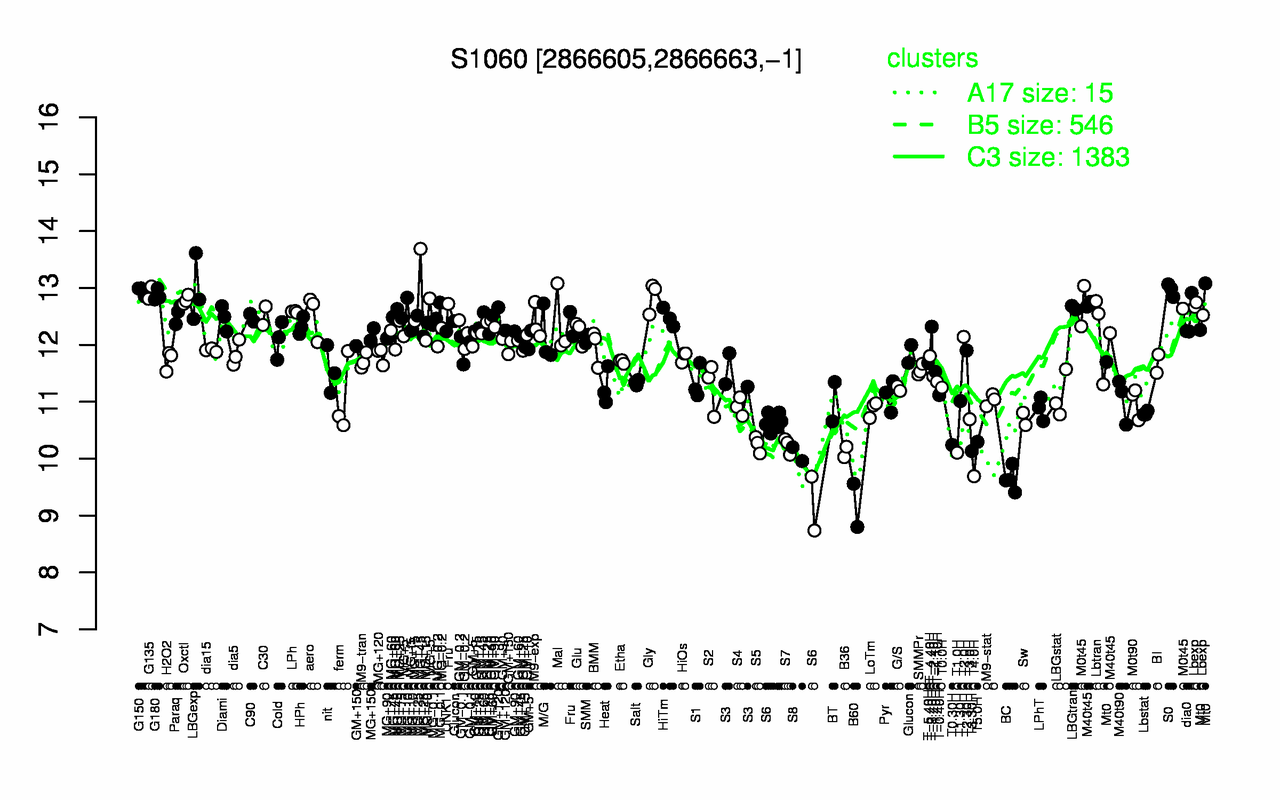
| S0 | LBGexp | G150 | MG+45 | G135 | G180 | Gly | Oxctl | M0t45 | LBGtran |
| 13 | 13 | 12.9 | 12.9 | 12.9 | 12.9 | 12.9 | 12.8 | 12.7 | 12.7 |
| B60 | BC | T4.0H | S8 | T1.0H | B36 | T3.30H | S7 | T0.30H | S5 |
| 9.18 | 9.64 | 9.69 | 10.1 | 10.1 | 10.1 | 10.1 | 10.2 | 10.2 | 10.3 |