| Start Page |
|
 |
| Start Page |
|
|
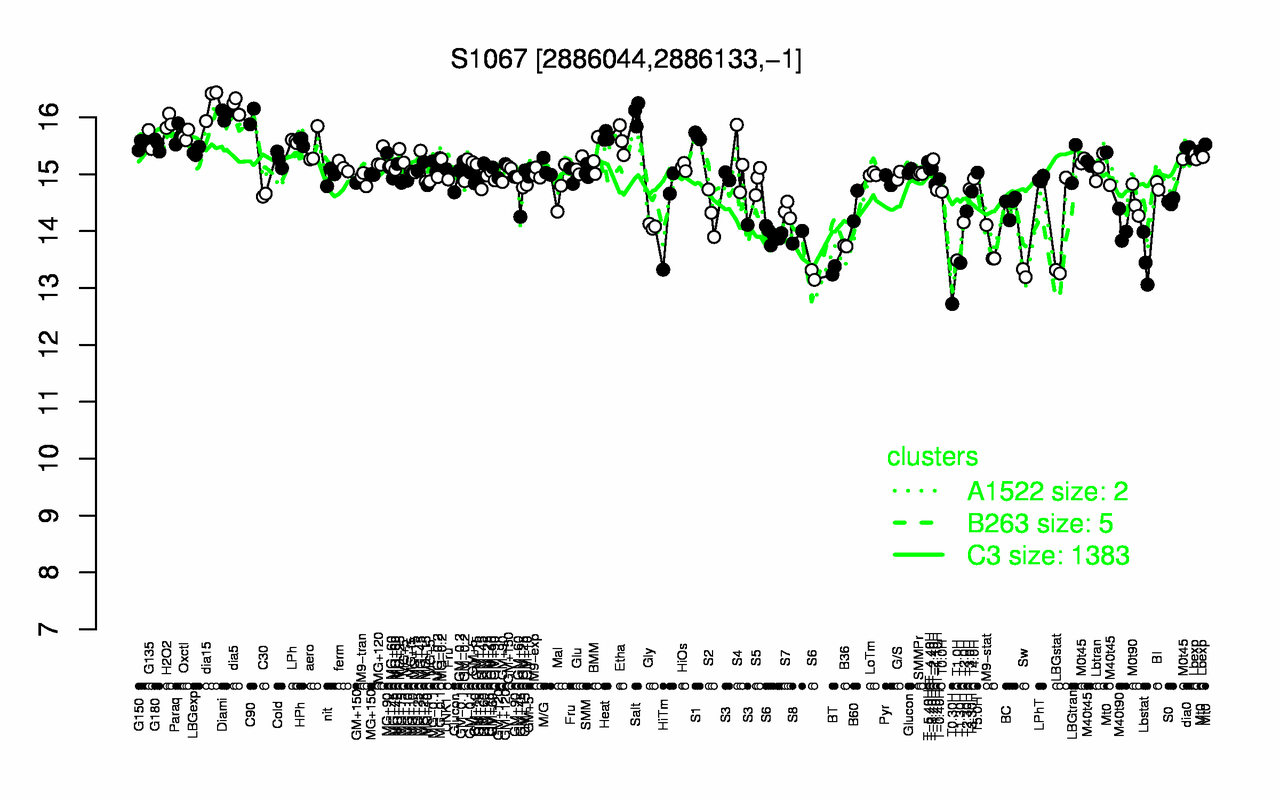
| dia15 | dia5 | Salt | Diami | C90 | H2O2 | Paraq | Oxctl | S1 | Heat |
| 16.3 | 16.2 | 16.1 | 16 | 16 | 15.9 | 15.7 | 15.7 | 15.7 | 15.7 |
| T0.30H | Sw | BT | T1.30H | T1.0H | Lbstat | M9-stat | B36 | S6 | LBGstat |
| 12.7 | 13.3 | 13.3 | 13.4 | 13.5 | 13.5 | 13.7 | 13.7 | 13.8 | 13.8 |