| Start Page |
|
 |
| Start Page |
|
|
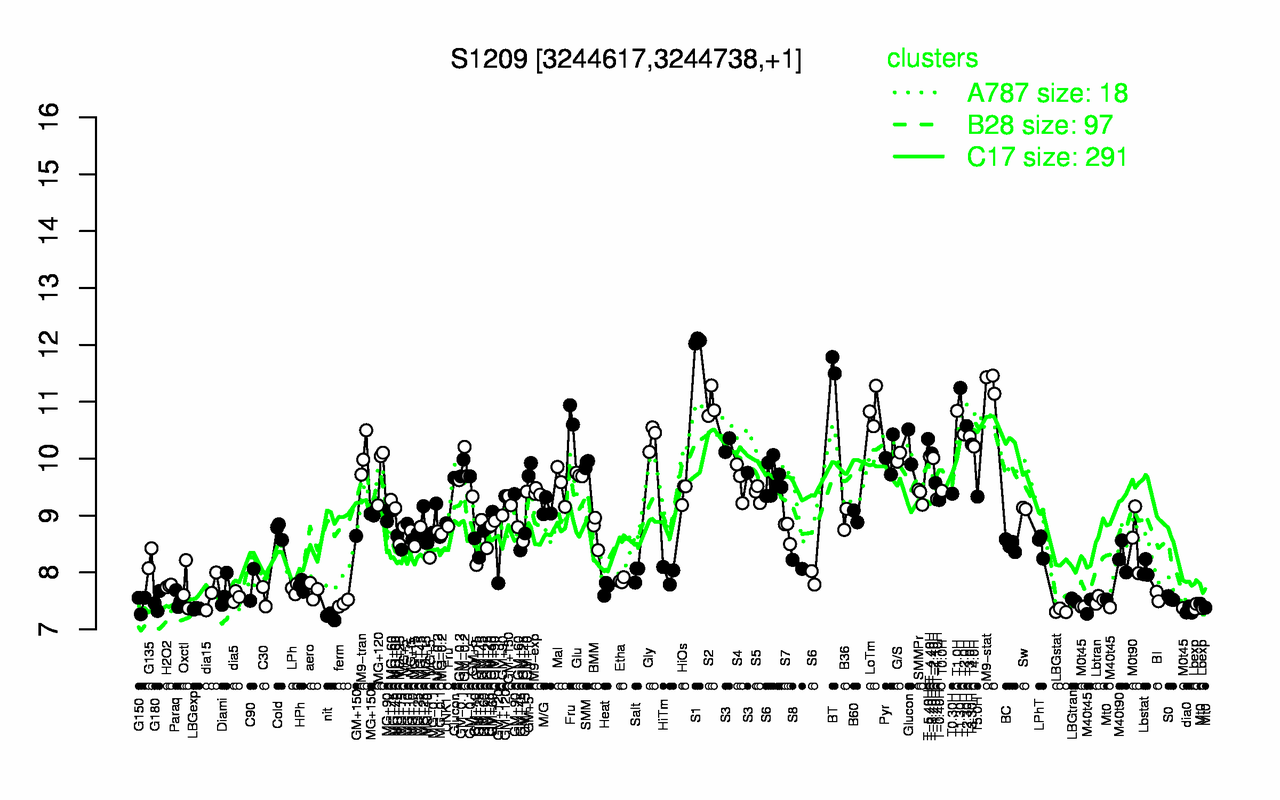
| S1 | BT | M9-stat | T1.30H | S2 | LoTm | T1.0H | T2.30H | T2.0H | T3.0H |
| 12.1 | 11.6 | 11.3 | 11.2 | 11 | 10.9 | 10.8 | 10.6 | 10.4 | 10.4 |
| nit | LBGstat | dia0 | LBGexp | Lbexp | M0t45 | M40t45 | Mt0 | ferm | G150 |
| 7.23 | 7.33 | 7.33 | 7.36 | 7.39 | 7.39 | 7.39 | 7.45 | 7.46 | 7.46 |